Breathing through the seasons: how temperature, wind and rain shape our air
Abstract
This article explores the seasonal variations in air pollution and the influence of meteorological factors on pollutant concentrations, focusing on data from the “Pure Cities” project in Belgium. Analyzing pollutants like PM2.5, PM10, and NO2, the study highlights how temperature, humidity, wind speed, atmospheric pressure, and precipitation affect air quality throughout the year. Findings show that pollutant levels tend to rise during colder months due to increased residential heating and reduced dispersion. The article discusses the importance of addressing seasonal pollution through targeted strategies, such as enhancing public transport, promoting green spaces, and aligning regulations with WHO guidelines.

Pollutants tend to rise during colder months due to increased residential heating and reduced dispersion
Overview
The subject of air pollution is occupying more and more space in our daily lives. Research and regulations around air quality are evolving and growing. We know that the air we breathe is not (always) as pure as it should be. But is this impact consistent throughout the year? Are there periods where atmospheric pollution is of lesser concern? This article aims to make sense of the patterns observed in atmospheric pollutant variations by looking at different meteorological parameters.
Let’s start with some numbers
Air pollution is a significant issue that affects both the environment and human health, impacting everything from respiratory health to overall well-being, as well as contributing to climate change. Alarmingly, 90% of the global population is exposed to polluted air daily, leading to 7 million deaths annually and causing substantial societal costs, estimated between 330 and 940 billion euros each year in the EU alone. Additionally, air pollution results in the loss of 1.8 billion working days annually, millions of new cases of childhood asthma, and premature births. In addition, poor air quality in cities, particularly from pollutants like fine particulate matter (PM), nitrogen oxides (NOx), and volatile organic compounds (VOCs), accelerates global warming.
Where did we get the data?
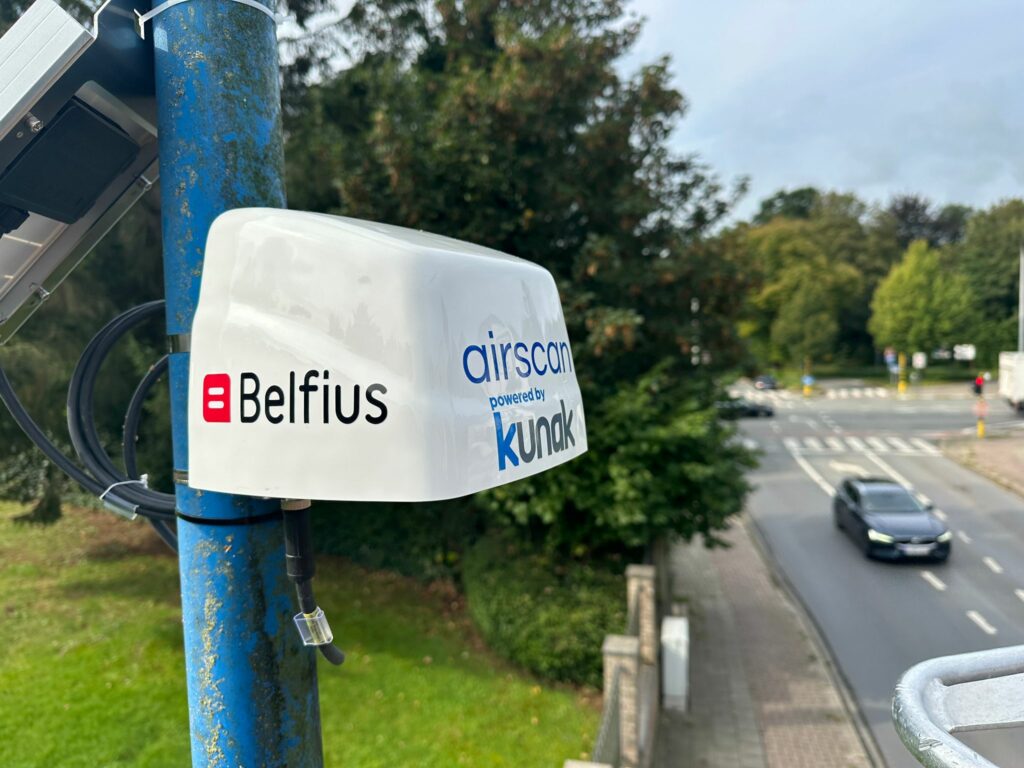
To address this pressing issue, Airscan and Belfius have initiated the “Pure Cities” project. This initiative is designed to map and improve air quality in Belgian cities, providing local governments with the tools and knowledge needed to combat air pollution effectively. Supported by Belfius, the project is offered free of charge to participating cities.
Through advanced air quality sensors, Airscan collects and analyses air quality data over a year for three main atmospheric pollutants: PM2.5, PM10, and NO2. The sensors capture real-time data every hour, collecting significant information about the evolution of these pollutants throughout the day.
PM-what?
PM2.5, or particulate matter smaller than 2.5 micrometers, is a significant health concern due to its ability to reach deep into the lungs and even enter the bloodstream. Exposure to PM2.5 can lead to a range of respiratory issues, including asthma and bronchitis, as well as cardiovascular problems like heart attacks and strokes (Lippmann et al., 2003). Over time, consistent exposure increases the risk of premature death, especially for those with pre-existing conditions. In children, it can hinder lung development and increase the likelihood of respiratory infections (Meo et al., 2021). Environmentally, PM2.5 contributes to reduced visibility and haze, influences climate change by altering the Earth’s radiation balance, and can contaminate soil and water, negatively impacting ecosystems (Lippmann et al., 2003).
PM10, which includes particles up to 10 micrometers in diameter, also poses serious health risks. These particles can be inhaled into the respiratory tract, leading to irritation, coughing, and aggravating conditions such as asthma. Long-term exposure to PM10 is linked to chronic respiratory diseases like chronic obstructive pulmonary disease (COPD), and it is associated with higher rates of hospitalization and mortality (Meo et al., 2021). On the environmental side, PM10 can settle on plants, reducing their ability to photosynthesize and grow. It also contributes to soil acidification and can degrade water quality by altering pH levels and introducing harmful substances to aquatic environments (Lippmann et al., 2003).
Nitrogen dioxide (NO2) is another major air pollutant that primarily affects the respiratory system. It can irritate the airways, worsening asthma and increasing susceptibility to respiratory infections. Long-term exposure to NO2 can lead to chronic respiratory diseases and decreased lung function (Meo et al., 2021). In the environment, NO2 contributes to the formation of ground-level ozone and fine particulate matter, which can harm ecosystems, reduce agricultural productivity, and damage buildings and monuments. It also plays a key role in the formation of acid rain, which can acidify soils and water bodies, leading to detrimental effects on plants and aquatic life (Lippmann et al., 2003).
Weather vs pollution
When calculating pollutant concentrations in ambient air for air quality analysis, it’s essential to consider the various factors that can cause fluctuations in these concentrations over time. Key meteorological parameters to account for include temperature, humidity, atmospheric pressure, wind speed, and precipitation, each of which plays a significant role in influencing air quality.
- Temperature
Temperature plays a big role in how much pollution is in the air. When temperatures are higher, like during the day when the sun heats things up, pollutants like particulate matter (PM) tend to spread out more quickly, leading to lower concentrations. However, high temperatures can also accelerate the formation of nitrogen oxides (NOx) in the atmosphere. This reaction is slower than the effect of sun radiation, which can also break down compounds such as NO2 into other polluting chemical compounds such as ozone. This is why during the day in the summertime NO2 levels tend to drop and in some cities smog appears due to the production of ozone.
- Humidity
Humidity, or the amount of moisture in the air, can also impact air quality. For instance, when the air is humid, the water vapor can have a cooling effect, which reduces the production of NOx. This effect is particularly noticeable in the spring when humidity is higher, potentially leading to lower levels of NO2 compared to winter. Humidity can also influence the formation of particulate matter as it causes particles to coagulate, therefore increasing concentrations.
Atmospheric Pressure
Atmospheric pressure, which is the weight of the air around us, can also influence pollution levels. For example, high pressure often leads to calm and stable weather, which can trap pollutants close to the ground favouring the formation of smog, this occurs especially in the winter. This can cause higher levels of particulate matter, such as PM10, especially in certain seasons.
- Wind Speed
Wind speed is a crucial factor in the dispersion of air pollutants. For example, research conducted in the Yangtze River Delta region of China showed that PM2.5 concentrations are heavily influenced by wind speed, among other meteorological conditions. During the fall, higher wind speeds can resuspend particles, leading to increased PM2.5 levels. Conversely, lower wind speeds in other seasons result in lower pollutant dispersion and higher concentrations (Zhan et al., 2023). Wind can carry aerosols over thousands of kilometers, these dust plumes are visible and trackable from satellite imagery. Saharan dust for example, can even go as far as Belgium, covering cars with a layer of dust and causing the irritation of eyes and nose.
- Precipitation
Precipitation is another important meteorological parameter that affects air quality. Higher precipitation levels during spring and summer can cause a washout effect, effectively reducing the concentrations of PM2.5 and PM10 in the air. This washout effect occurs when rainwater captures airborne particles and removes them from the atmosphere, reducing concentrations (Bodor et al., 2020).
What about Belgium?
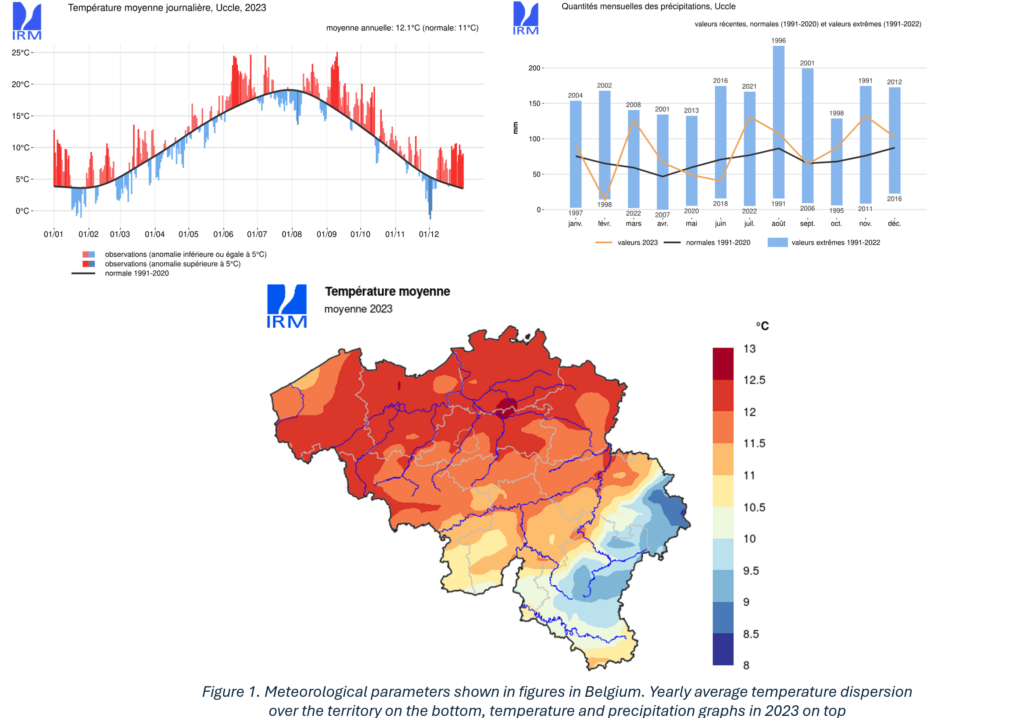
The Belgian territory follows the Northern hemisphere seasonal and temperate climate patterns with highest temperatures in the months of July and August and lowest temperatures in December and January. Over the past 30 years, the IRM (L’Institut Royal Météorologique) determined precipitation levels (in mm) were highest in the fall and winter – lowest in the spring. Precipitation increases over the summer period, with 2024 marking the year with record breaking rainfall in June and July. Belgium is located within the polar front, resulting in two dominant wind streams depending on the seasons. For the most part of the year dominant winds come from the Southwest bringing in warmer air, during the change of seasons the wind comes from the Northeast. Wind speed remains highest by the coast – for the rest of the country, it remains mostly below 20 km/h.
Before we start: what are the current regulations?
The thresholds for the three pollutants described in this article established by the WHO in their 2021 directive are the following:
- 5 µg/m3 for PM2.5
- 15 µg/m3 for PM10
- 10 µg/m3 for NO2 (10 µg/m3 is equivalent to 5ppb of nitrogen dioxide)
These thresholds, however, are not yet integrated in the European legislation. Today, EU directives have thresholds that are more than two times higher, but they are currently under review and should soon be updated with new thresholds for 2030.
Let’s dive into the data
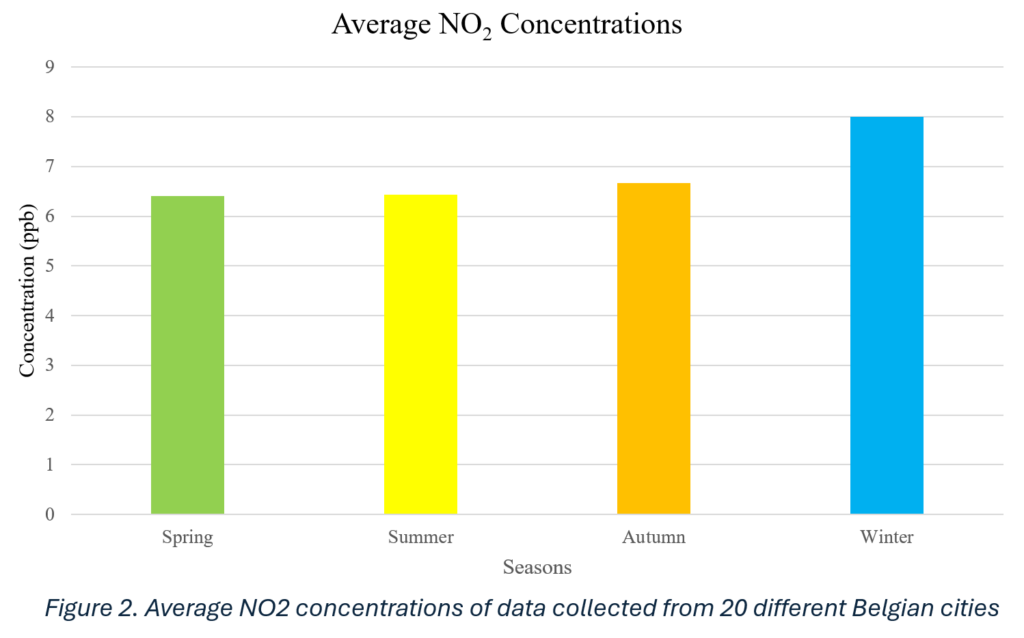
Airscan, through the Pure Cities project, has collected data from 20 Belgian cities so far, spread out through the Flanders, Wallonia and Brussels region. The results from the measurements taken show similar patterns regarding pollutant concentrations linked to the change of season. The following graphs show the increase in atmospheric pollutants from the springtime to wintertime.
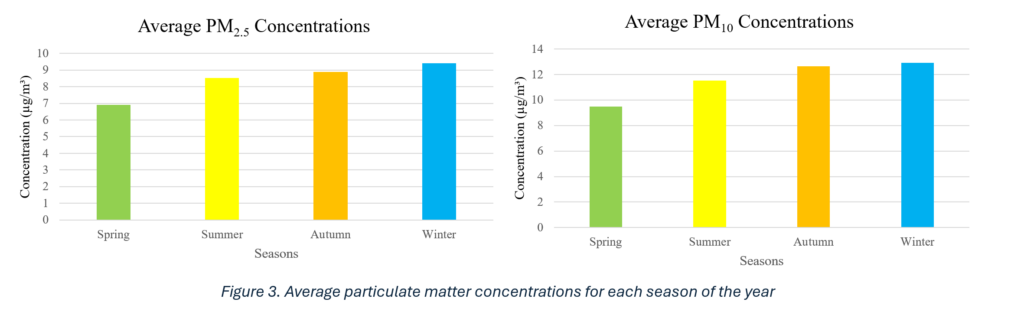
From all the values collected over the different periods, all three pollutants tend to increase as temperatures get cooler. This effect is particularly marked with nitrogen dioxide, showing a 20% increase from the autumn to winter months. All three pollutants are lowest during the springtime, due to the change of weather – wind direction changes and wind speeds increase which dilutes concentrations. In Belgium we see peaks of pollen in the months of June for grasses for example which may contribute to particulate matter concentrations during the spring and summer periods.
Keeping these values in mind, figures 2 and 3 show that these thresholds are only respected for large particulate matter throughout all seasons. NO2 and PM2.5 concentrations overshoot the threshold during all four seasons.
The following graphs take the data collected in each of the municipalities participating in Pure Cities and display their monthly averages for the three measured pollutants. These figures overlap with meteorological data extracted from IRM.
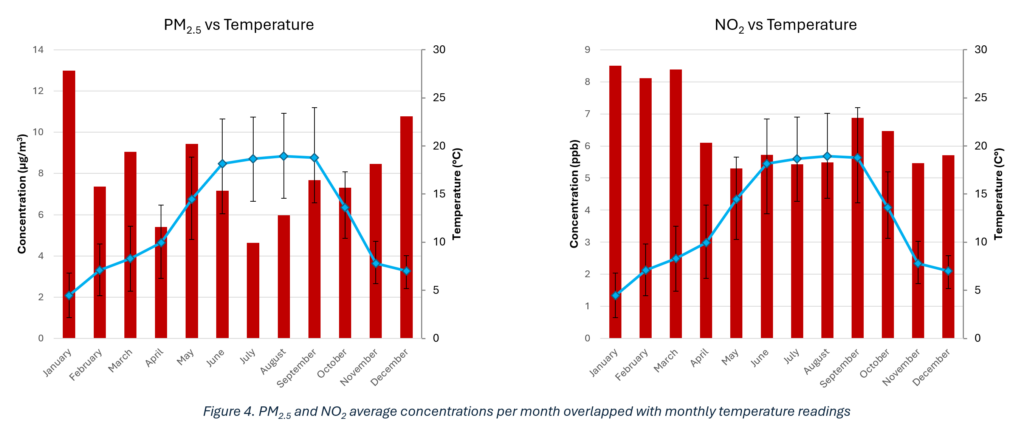
These graphs show the temperature variations over the months based on IRM data. In comparison with average pollutant concentrations, the highest concentrations were measured during the coldest months. This is explained by the increase in emissions from residential pollution such as heating, as well as increased use of transportation. Although increased temperatures lead to the formation of reactive nitrogen oxide species such as NO2, these are also very quickly broken down during the warmer months leading to lower concentrations.
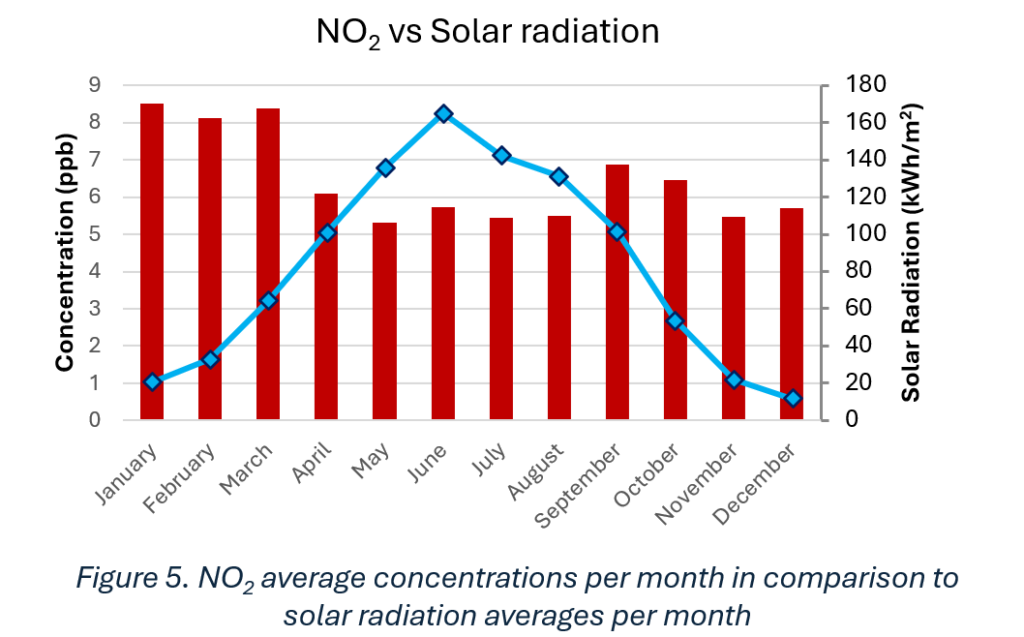
This effect is reflected in the graph above, which plots solar radiation patterns over the year. We see some of the lowest concentrations during the summertime when UV radiation is the highest. This is not always the case though, as it is seen in the month of February, where the average concentration drops. Many parameters influence the dispersion and dilution of pollutants – this would be the effect of a different meteorological phenomenon underlining one of the many challenges of air quality analysis.
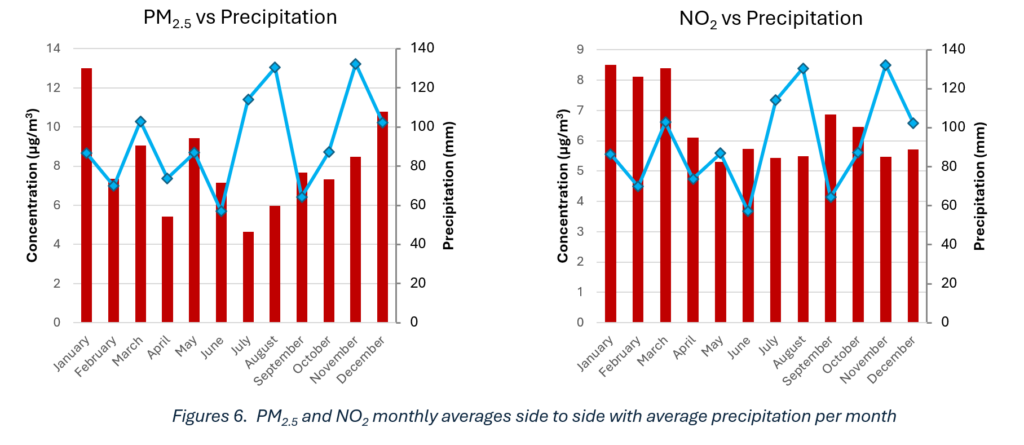
Rainfall can act as an atmospheric cleanser as it washes out pollutants from the air. In Belgium the months with the most rainfall was in July and August, which corresponds to some of the lowest concentrations detected for both PM2.5 and NO2. On the other hand, November saw a lot of rain, however the concentration of the atmospheric pollutants did not significantly decrease due to other factors playing a larger role.
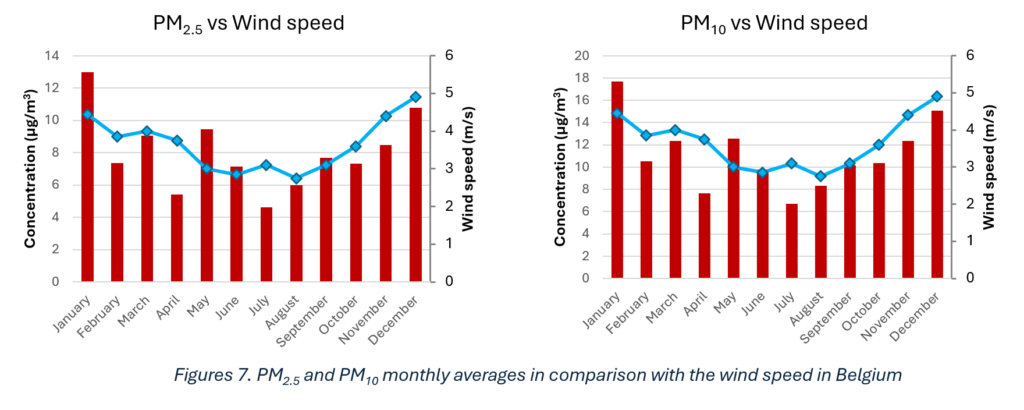
As mentioned previously, wind speed can lead to either the resuspension of particles in the case of PM2.5 and PM10, or the dispersion and therefore dilution of these pollutants. From these graphs, the dominating effect is the resuspension of particles, as higher wind speeds correlate to higher concentrations of particulate matter in the atmosphere.
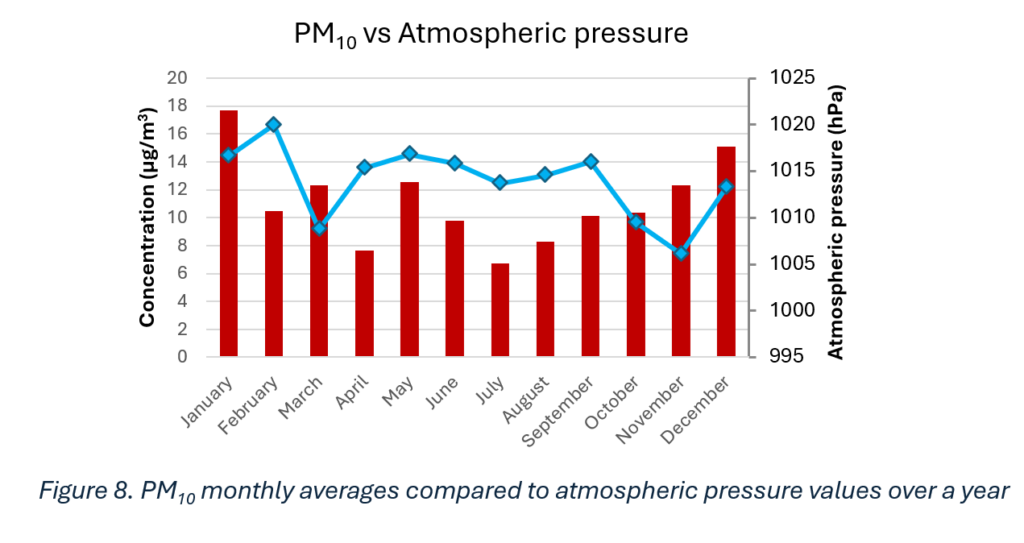
Atmospheric pressure patterns in Belgium remained quite stable throughout the warmer period with a sharp decrease during seasonal changes. The highest atmospheric pressure is seen during the winter. This correlates to higher concentrations seen during the cold months, especially in the case of heavier particles such as PM10.
What is next?
To mitigate air pollution, especially considering the seasonal variations observed, several strategies can be employed. Firstly, reducing emissions of nitrogen dioxide and fine particulate matter is crucial, as these pollutants consistently exceed WHO- recommended thresholds across all seasons. One effective approach is enhancing public transportation and promoting the use of electric vehicles, which can significantly cut down traffic-related NO2 emissions. Additionally, implementing stricter industrial emission controls, particularly during the colder months when pollution levels spike, can help manage wintertime pollution peaks.
Another key strategy involves improving urban green spaces. Trees and vegetation not only absorb pollutants but also help regulate local temperatures, potentially reducing the accumulation of pollutants during warmer periods. Furthermore, increasing public awareness and encouraging behavioral changes such as reducing the use of wood-burning chimney stoves in winter, can also contribute to lower pollution levels. Studies have shown that residential emissions contribute to at least 60% of PM emissions. This includes for the most part residential heating. Part of the behavioral changes need to also include an awareness of appropriate times to heat homes, or as an alternative implement automatic heating systems if possible while also considering renovations as a final option if the home is badly isolated. Lastly, policymakers should consider aligning local air quality regulation with WHO guidelines to ensure that pollutant concentrations remain within safe limits year-round, protecting public health and the environment.
Latest Articles

Ventilation Audits in Flanders Care Homes: Airscan’s 40‑Site Study on Indoor Air Quality
Airscan’s audit of 40 Flemish care homes uncovered critical ventilation issues: nearly 1 in 4 rooms exceeded safe CO₂ limits. With VEB and VIPA support, the study offers data-driven solutions to protect residents’ health.
Smart Cities: Keys to Achieving Excellent Outdoor Air Quality
See how smart cities achieve excellent air quality with smart tech, green spaces, and clean transport. Discover proven strategies for cleaner urban air.

Belgium updates its air quality index following stricter WHO Standards
In November 2022, Belgium’s air quality monitoring scheme, Belgian Air Quality Index (BelAQI), underwent a major revision to better reflect the health risks associated with air pollution. Managed by IRCEL – CELINE, the updated index now aligns with the World Health Organization’s (WHO) 2021 air quality guidelines, introducing stricter thresholds and faster reporting.
Subscribe for the freshest air quality news!
