Air Quality in Belgium
Analyzing air pollution levels and their fluctuations over the past five years in five Belgian cities.
The importance of good ambient air quality in cities has finally received high recognition over the past few years, thanks to more and more evidence proving the direct link of air pollution to premature death rates. In addition, the long-awaited update on safe air pollution limits released by WHO in 2021 has made many people think about the quality of the air they breathe.
To address this important question, the Airscan team prepared a technical report delving into the analysis of air pollution levels and their fluctuations over the preceding five years across five cities in Belgium.
The analysis was performed based on the open-source Belgian air quality monitoring data portal IRCELINE.be. To ensure transparency of to-be-reported values, our team has chosen one air quality measuring reference station in the centre of the five most densely populated cities in Belgium (One station per City):
Brussels – Station 41R001 (Chau. de Ninove, 1080 Molenbeek-Saint-Jean)
Antwerp – Station 42R805 (Belgiëlei, 2018 Antwerpen)
Gent – Station 44R701 (Koning Willem I-kaai 8, 9000 Gent)
Charleroi – Station 45R501 (Rue Emile Tumelaire, 6000 Charleroi)
Liege – Station 43R222 (Rue du Chéra, 4000 Liège)
The analysis includes data for Particulate Matter 10 (PM10), Particulate Matter 2.5 (PM2.5) and Nitrogen Dioxide (NO2). The obtained data was compared with the corresponding standards set by the European Union and the World Health Organisation, which are reported in the table below.

1. Particulate Matter 10 (PM10)
While all annual average PM10 concentrations measured in Belgium’s five most densely populated cities exceeded the WHO threshold limit from 2019 to 2023, Charleroi stood as an exception in 2023 with an average annual concentration of 13.4 µg/m³. Conversely, all values reported in Table 2 adhered to the standard set by the European Union.
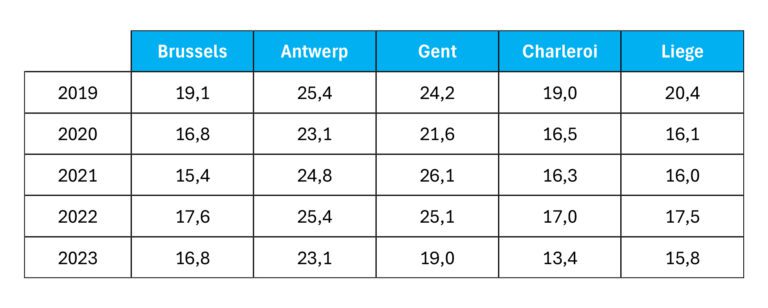
If analysing the pollution levels over the last five years in each city, it is not possible to conclude or draw a stable common pattern. For instance, in Brussels, the PM10 concentration reached the minimum average level in 2021 when the reported value was 15.4 µg/m³. Afterwards, in the two consequent years, the pollution magnitude slightly increased and remained at the same level as in 2020.
Unfortunately, no coarse dust particle reduction was observed over the analysis period in Antwerpen. The average values fluctuated between 23 and 25 µg/m³. Oppositely, in Gent (another city in the Flemish part of the country), there was a notable 24% reduction in pollution between 2022 and 2023. Although the average PM10 concentration dropped down in the city, it remained above the most recent threshold limit set by the WHO.
A minor improvement was observed in the Walon part of Belgium, where the average annual PM concentration was at the highest level in 2019, followed by a short decrease and remained relatively stable during the last four years in Liege. The city of Charleroi reached its lowest recorded PM10 concentration of 13.4 µg/m³ in 2023.
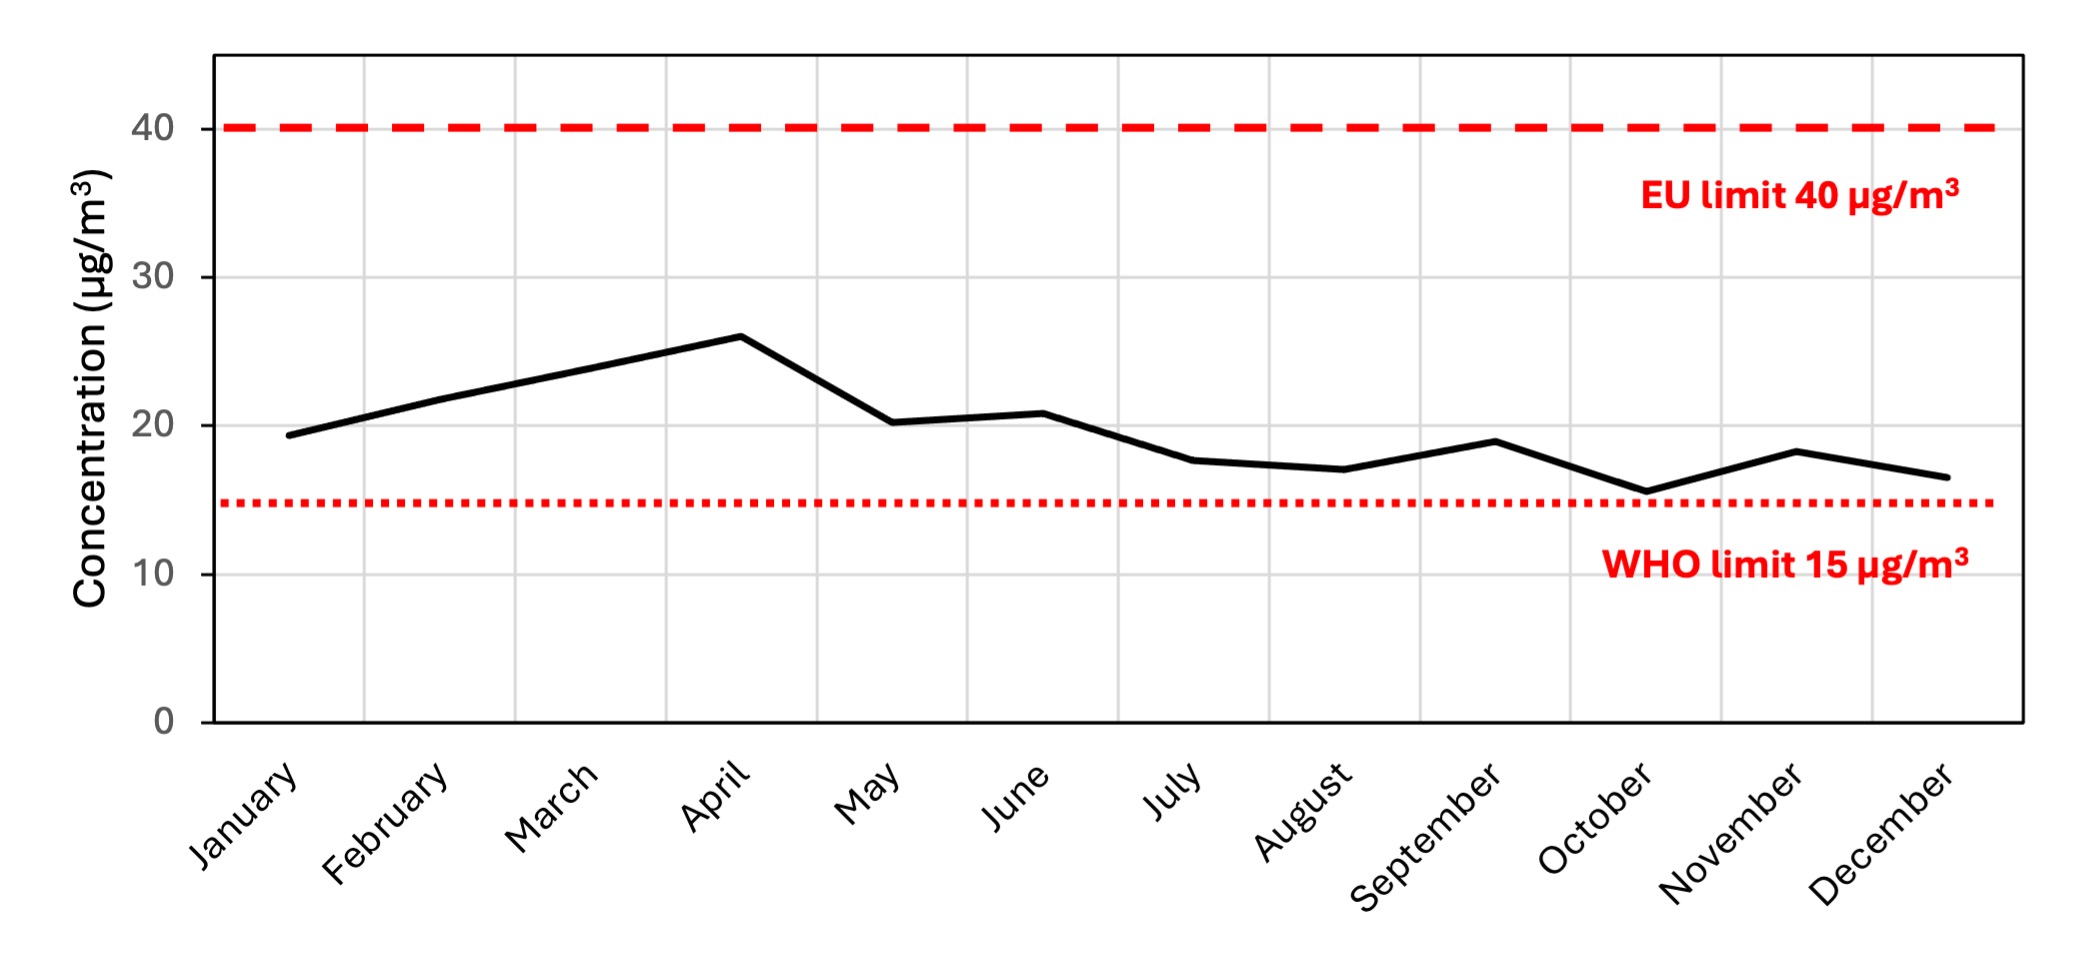
An overview of the above described trends is presented in the figure below.
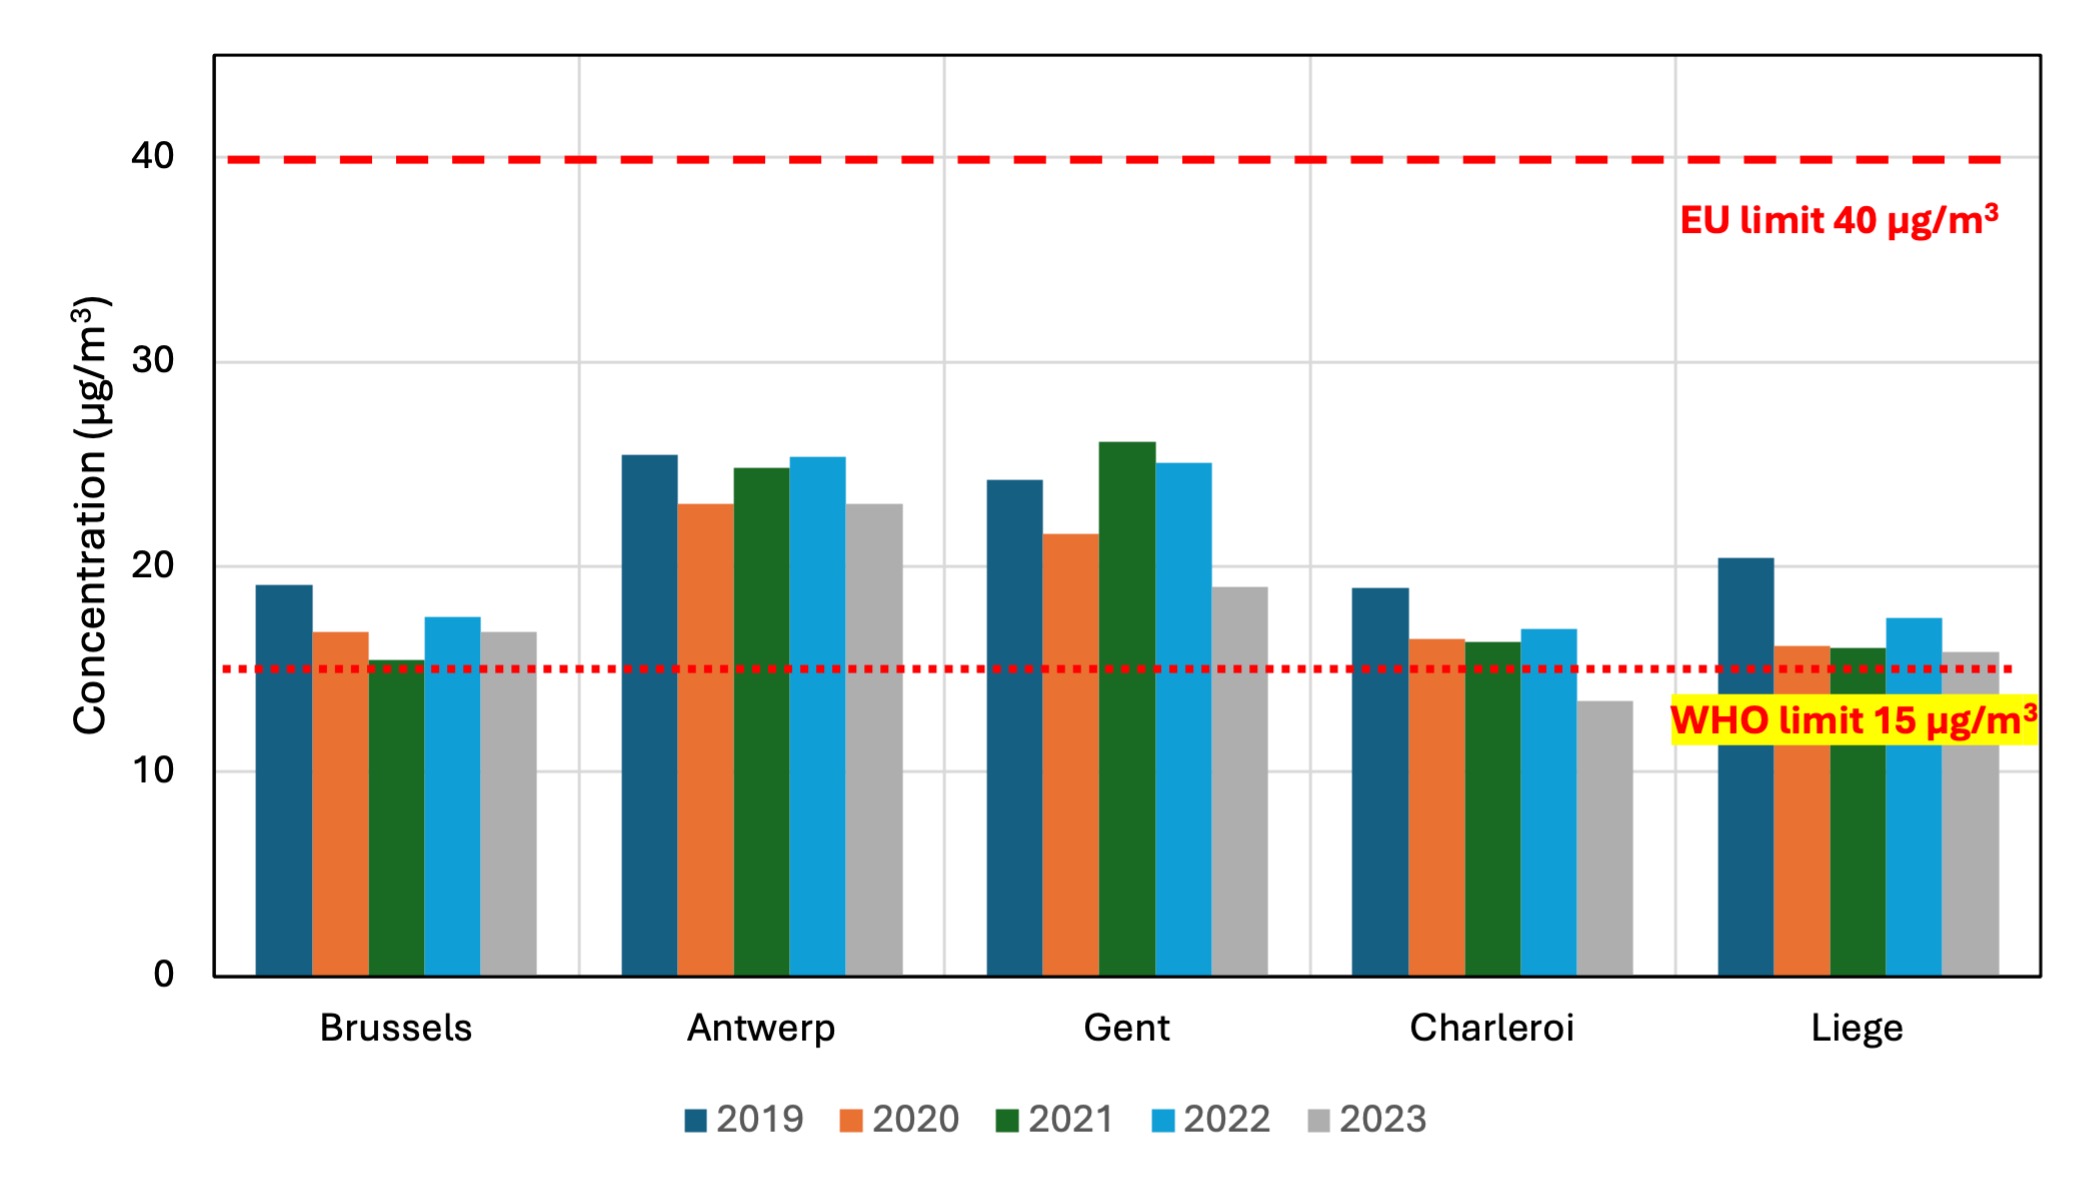
In conclusion, upon analyzing the averaged PM10 concentration profile, Airscan noted that the highest PM10 values occurred during the Winter-Spring period, peaking in April. This increase can be attributed to the heating season, followed by PM pollution associated with pollen. Below is the trend of the averaged PM10 concentration.
2. Particulate Matter 2.5 (PM2.5)
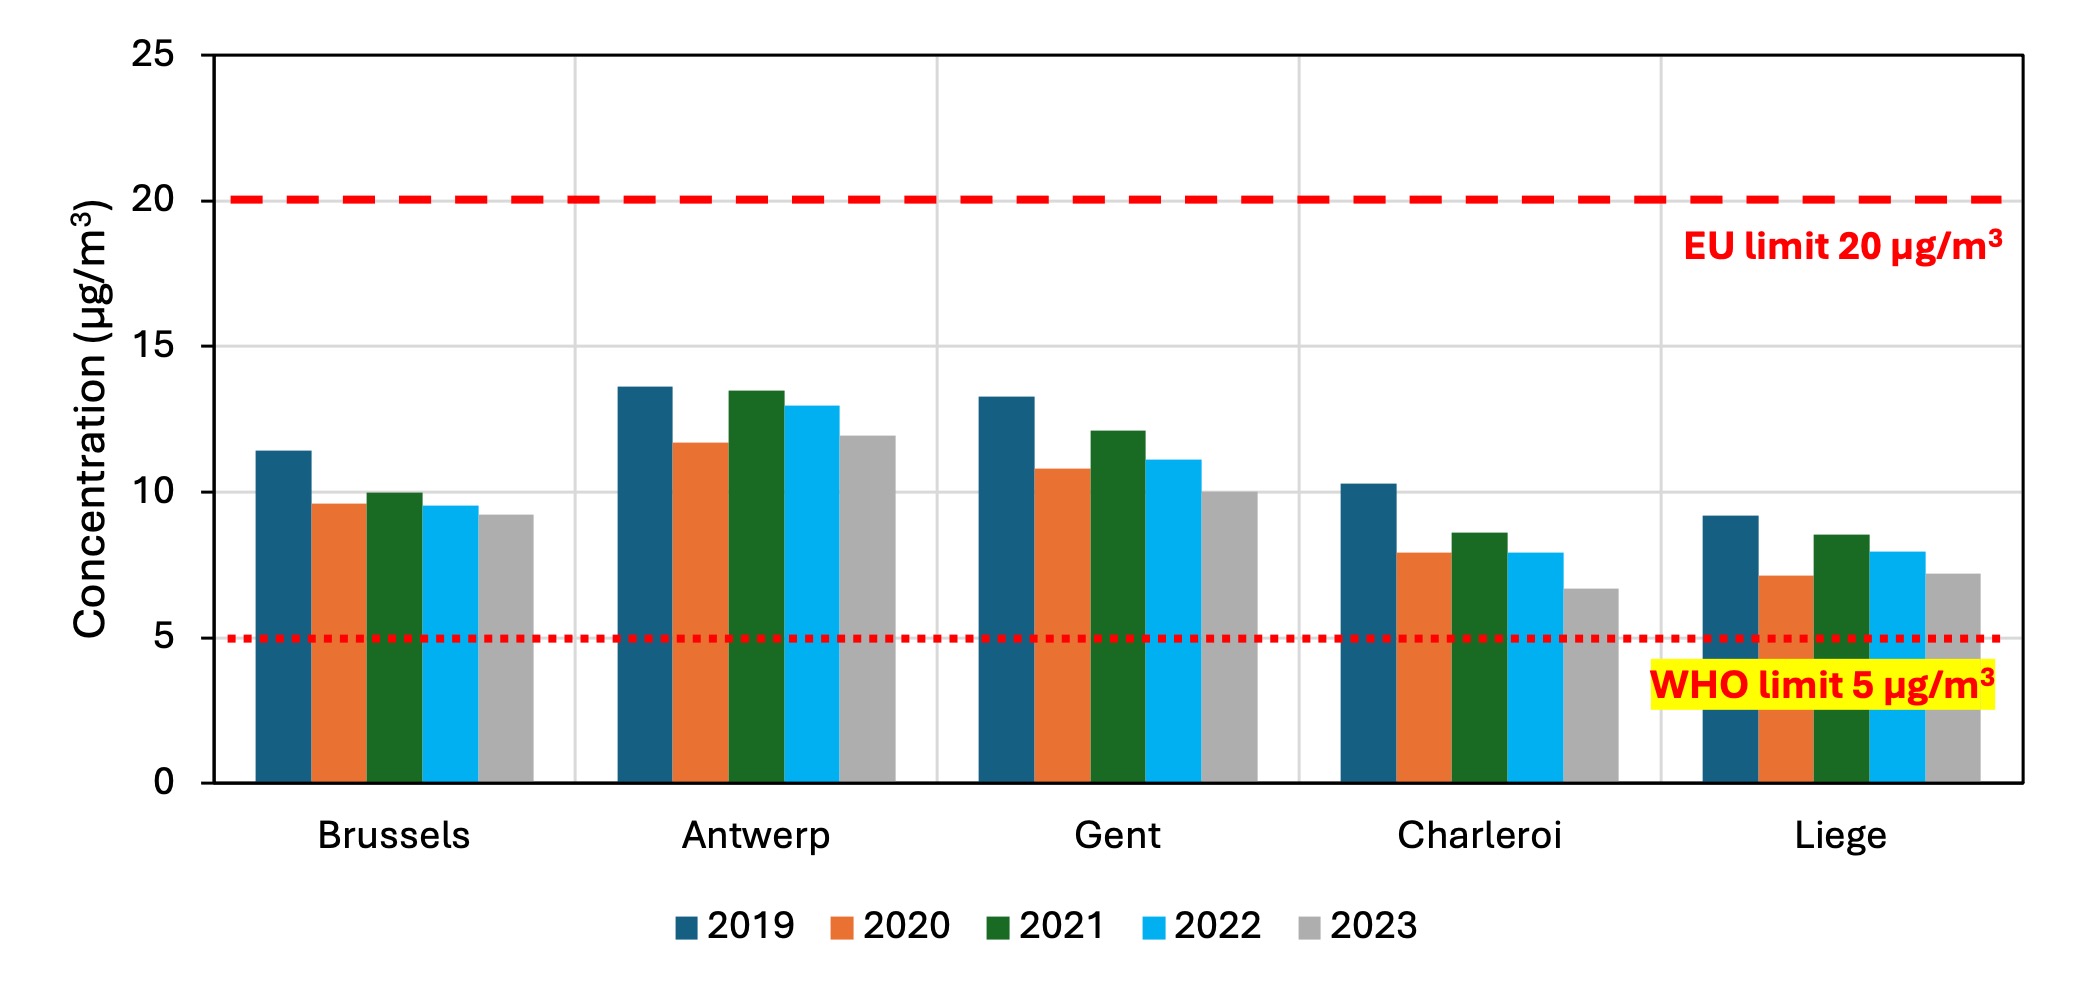
Similar to the concentration of coarse PM10 particles, the average annual fine dust (PM2.5) concentration was above the corresponding WHO threshold in all the cities included in the study. Oppositely, the EU limit value was respected in all the cities. In 50% of cases, the difference between the EU limit and measured value exceeded a factor of 2.
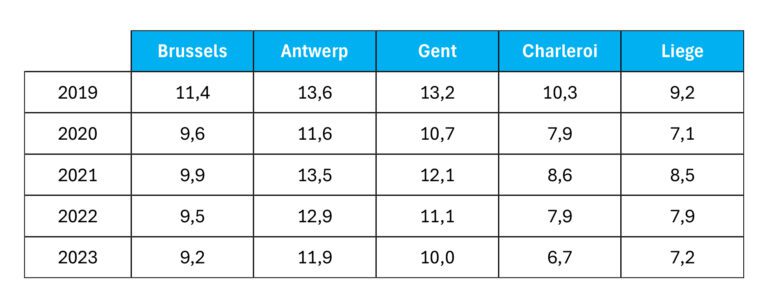
Also, it is not possible to draw a common trend between the cities, except for the PM2.5 concentration drops in 2020, which is probably associated with the COVID lockdowns around the country.
3. Nitrogen Dioxide (NO2)
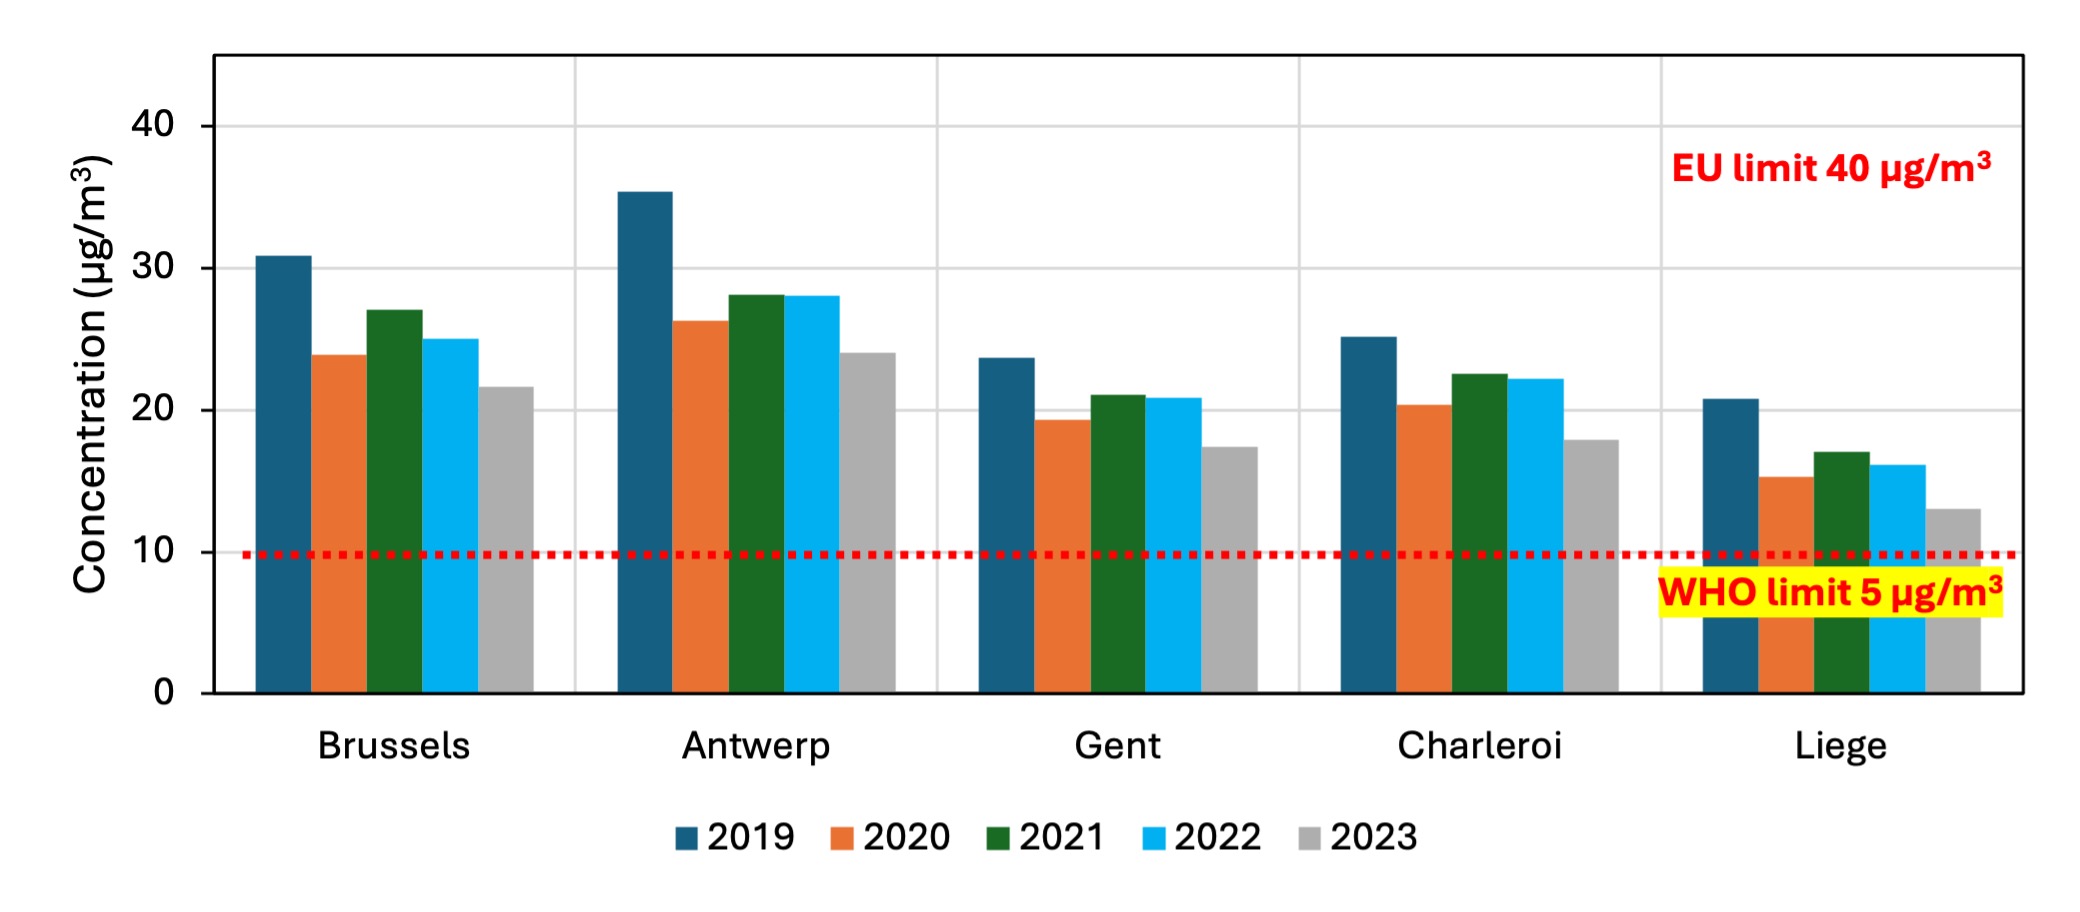
Echoing the trends of PM2.5 and PM10, nitrogen dioxide concentrations exceeded WHO standards but remained well below EU limits (Table 4). The highest gas concentration was measured in Antwerp in 2019 (35.4 µg/m³), while the lowest values was recorded in 2023 in Liege (13 µg/m³).
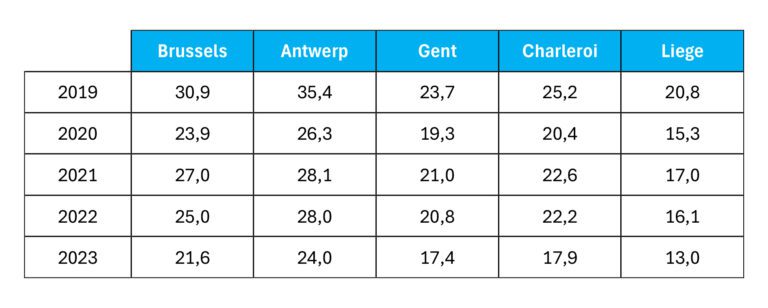
Looking at the trends of how average annual NO2 concentration evolved in the cities over the last five years, it is possible to conclude the following:
- NO2 annual concentration decreased by more than 20% between 2019 and 2020 (COVID lockdown and reduced traffic flow are the main reasons for the tendency)
- Annual average NO2 concentration recovered in the two consequent years after the COVID lockdown in all cities but did not reach the pre-pandemic levels.
- A second drop, which led to the lowest-ever average annual gas concentration in the country, was observed in 2023.
4. Conclusion
This study, similar to a few other reports conducted by other organisations, once again confirmed that the outdoor air quality conditions in Belgium do not meet the limits defined by the WHO. The annual average particulate matter 10 (PM10) concentration measured in Charleroi in 2023 is the only value that met the standard.
However, it is essential to mention that the air pollution threshold limit update performed by the WHO in 2021 is rigorous and ambitious. Last week, The Guardian reported that only a few places around the World met these standards in 2023. Thus, the Airscan team anticipates promptly revising the existing European Union air quality pollution limits. This update should offer a comprehensive evaluation of the health issues linked to poor air quality while remaining attainable in the foreseeable future.
In conclusion, it is very important to add that technological progress in conjunction with initiatives and projects designed to reduce air pollution is already noticeable. Notable, the values given in this article for 2023 were lower than those measured in the COVID year, when almost no cars were on the roads and factories were idle.
Latest Articles

School air quality: protect children today | Airscan
Children are more vulnerable to air pollution at school. Key Brussels data, effective measures (school streets, LEZ), and Airscan solutions: monitoring, smart ventilation, certification‑ready reporting.
Ventilation Audits in Flanders Care Homes: Airscan’s 40‑Site Study on Indoor Air Quality
Airscan’s audit of 40 Flemish care homes uncovered critical ventilation issues: nearly 1 in 4 rooms exceeded safe CO₂ limits. With VEB and VIPA support, the study offers data-driven solutions to protect residents’ health.
