Volatile organic compounds around us
There are always pollutants and chemicals present in the air that can cause damages of human’s body over time. Some of these pollutants are called volatile organic compounds, or VOCs. Volatile organic compounds are considered as one of the most common indoor and outdoor air pollutants that present in the majority of premisses. In most cases, a person exposed to high VOCs concentration does not know about the presence of the pollutant and potentially harmful health effects that can be observed over time. There is a long list of objects considered as indoor VOCs pollution source. VOCs can be found almost everywhere, in a new house that was just built (building materials, coatings, finishes, paints and sealants), in cars (plastic details, upholsteries and lubricants), in stationeries (ink and glue) in cigarettes and even in sprays that so actively used in shopping centres and bathrooms. In this article, Airscan presents a case study where VOCs caused by use of six different air freshener sprays were monitored.
Experiment overview
The primary idea of the experiment is to monitor changes in the concentration of volatile organic compounds after use of air freshener spray in a regularly occupied room. Moreover, the indoor concentration of particulate matter (PM) was monitored. For the experimental work air fresheners from different price range were selected – “Air wick”, “Carrefour”, “Arunspray”, “Glade” and “Febreze” (Figure 1). Each freshener except Arunspray was used only once. On the other hand, Arunspray was placed into “Air wick” automatic freshener, and the frequency of the device was adjusted to the minimum.
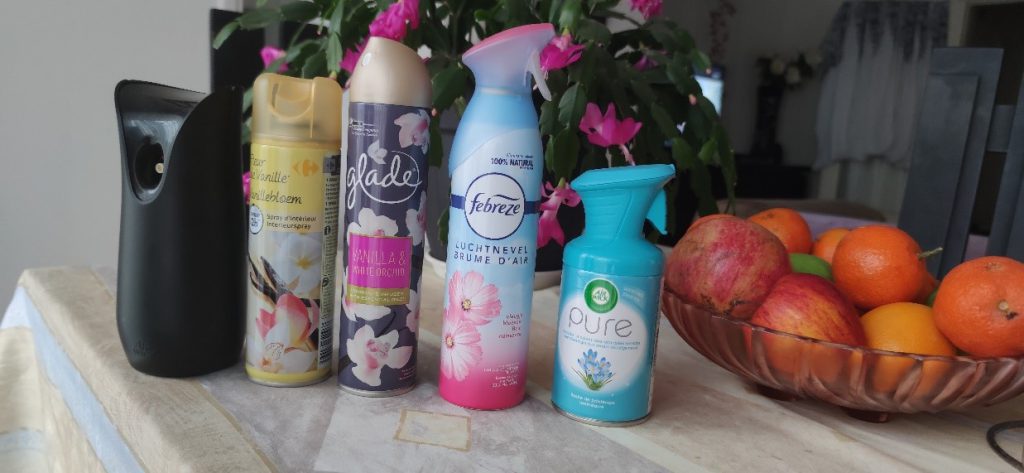
Figure 1. Air fresheners tested. The experimental work was conducted in an enclosed room with the following characteristics: Room area: A = 16 m2 Ceiling height h= 2.5 m
An advanced air quality logger (NEMo) with Photoionization Detector (PID) was used for the measurement campaign of the experiment. A technical overview of the sensor is given below: Lamp type: Krypton Lamp power = 10.4 eV Measurement range: 1 ppb…50 ppm Accuracy: ±3% Calibration: calibrated according to isobutylene
Average indoor TVOCs concentration in the tested room was measured for seven days before the start of the experiment. The results showed that the average indoor TVOCs concentration in the room was in the range between 250- 350 ppb. Thus, concentration in the range between 250-350 ppb was considered as a zero level of the room.
Results
This section represents results obtained from the experimental part of the case study.
Air Wick
The concentration of volatile organic compounds started to increase rapidly just after aerosol was used in the tested room. The maximum value detected by the device was 1706 ppb. Such a high indoor concentration of VOCs corresponds to “very bad” indoor air quality index. Moreover, the following observation showed that the concentration of the pollutant remained high for the following 18 hours. The results are given in the Figure below.
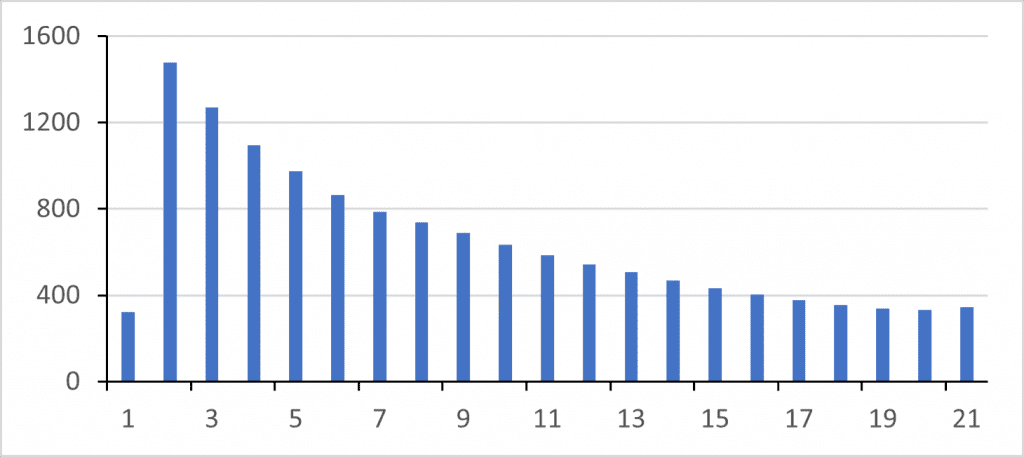
Figure 2. TVOCs concentration profile caused by the spray of “Air Wick” air freshener_
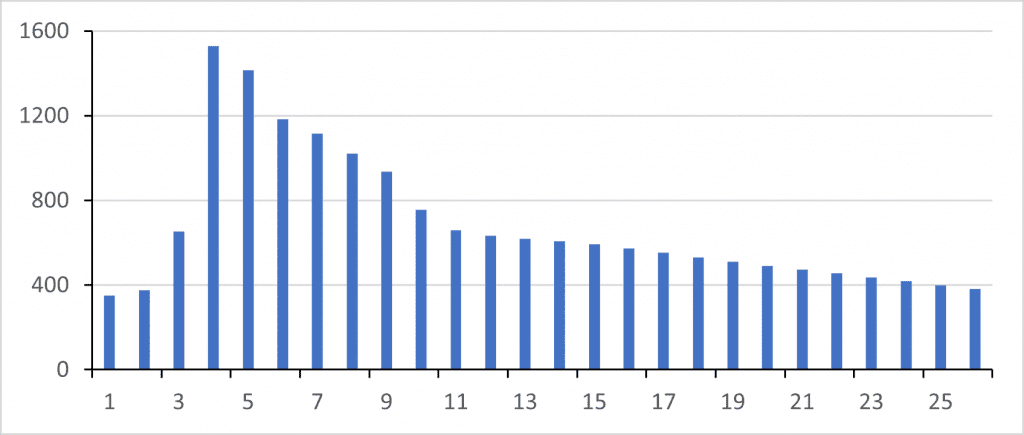
Figure 3. TVOCs concentration gradient caused by the spray of “Carrefour” air freshener
Carrefour
Identically to the previous test “Carrefour” air freshener resulted in elevated VOCs concentrations. Moreover, aerosols generated by the air fresheners caused a high concentration of particulate matter. In this way, the concentration of PM2.5 increased to 100 ug/m3 at the same time as peak TVOCs level was observed. Finally, the spray has a robust and persistent smell. VOCs’ concentration remained high in the room for the following 20 hours. The results of the experiment are shown in the following diagram.
Arunspray + Air Wick Device
Air wick device is an automatic air freshener with an adjustable frequency of spraying. The results of the experiment showed that the use of such device results in a continuous increase of Volatile organic compounds. The concentration was gradually increasing in the room and reached 1600 ppb after 17 hours of the device working in the room. Therefore Airscan does not recommend to use such devices continuously in enclosed or semi inclosed rooms. The results are given in the figure below.
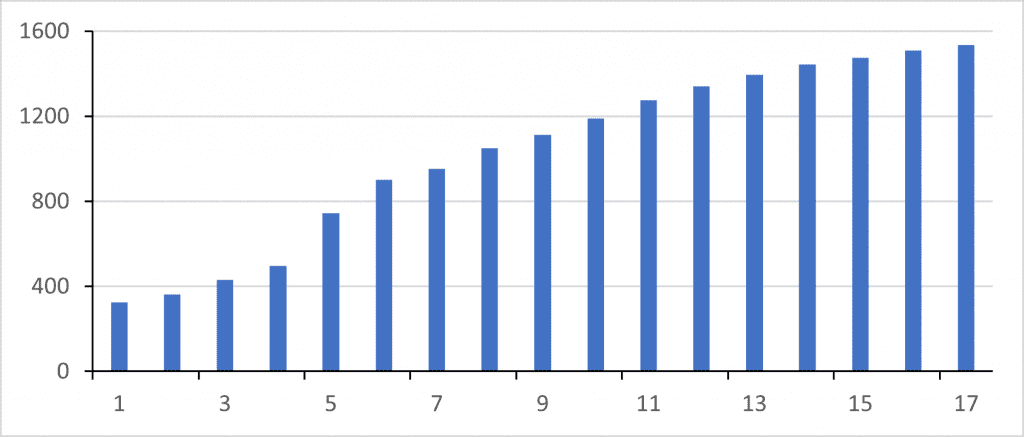
Figure 4. TVOCs concentration profile caused by the spray of “Arunspray” in combination with “Air Wick” device
Glade & Febreze
Finally, Glade and Febreze airfresheners showed the lowest increment of VOCs. The maximum concentration caused by Glade was 808 ppb and by Febreze 580 ppb. Moreover, the aerosols tested has low persistency. Time needed for the stabilization was much lower in comparison with previous fresheners. For example, concentration of VOCs stabilized within 6 hours after “Glade” spray was used and withing 4 hours after “Febereze” aerosol used. The results are given in the figures below.
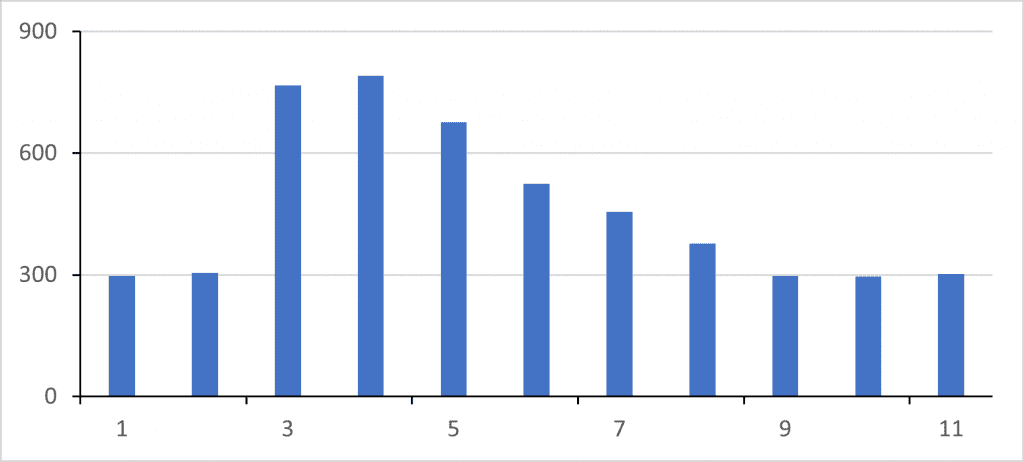
Figure 5. TVOCs concentration gradient caused by the spray of “Glade” air freshener
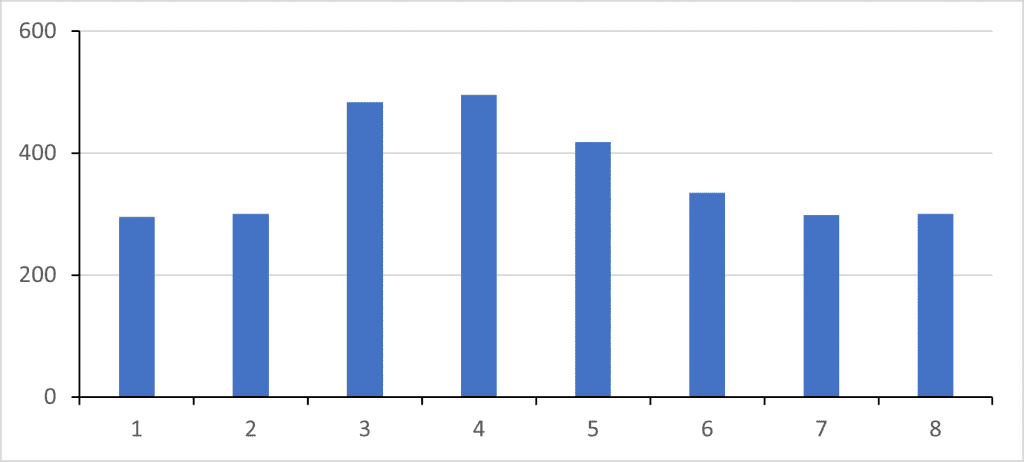
Figure 6. TVOCs concentration gradient caused by the spray of “Febreze” air freshener
Summary table
Finally, Airscan prepared a summary table with an overview of the experimental data:
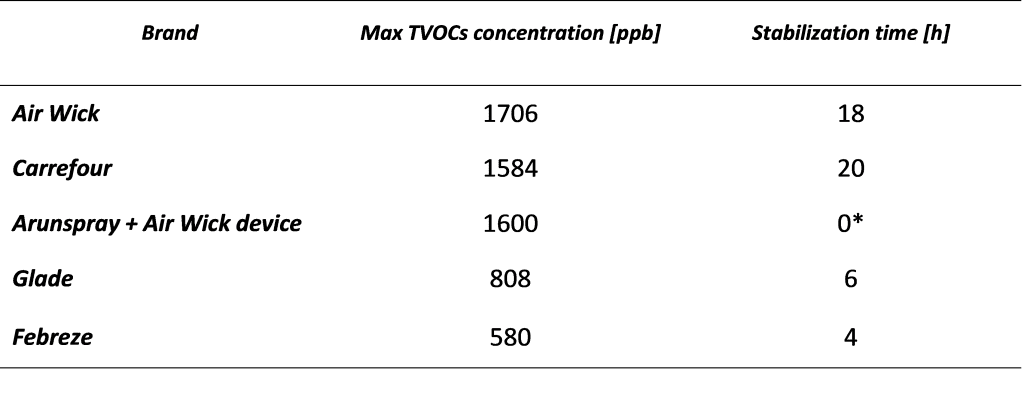
*Concentration of TVOCs was continuously increasing while the device was on.
Conclusion
All air fresheners used in the current study experiment caused a concentration increase of volatile organic compounds. The magnitude of the pollution was different from one spray to another. Moreover, the persistence of each aerosol was not the same that resulted in a different time needed for the concentration to return back to the “zero” level. This study is another proof of famous citation – “everything is toxic it just depends on the dose”. Therefore, Airscan strongly recommends only mindful usage of air fresheners and does not advise to spend much time in places with artificial smells and poor ventilation.
Learned something? Feel free to share.

School air quality: protect children today | Airscan
Children are more vulnerable to air pollution at school. Key Brussels data, effective measures (school streets, LEZ), and Airscan solutions: monitoring, smart ventilation, certification‑ready reporting.

Airscan Completes Three WELL Certifications in September as Accredited WELL Performance Testing Provider
Back Introduction Brussels, September 2025 – Airscan is proud to announce the successful completion of three WELL Certifications in Belgium this September, reaffirming its role

Ventilation Audits in Flanders Care Homes: Airscan’s 40‑Site Study on Indoor Air Quality
Airscan’s audit of 40 Flemish care homes uncovered critical ventilation issues: nearly 1 in 4 rooms exceeded safe CO₂ limits. With VEB and VIPA support, the study offers data-driven solutions to protect residents’ health.
