Most conversations about indoor air quality focus on offices – spaces with managed ventilation systems, facilities teams, and certification frameworks. The average apartment gets far less attention, which is worth examining, given that Europeans spend somewhere between 80 and 90 percent of their time indoors. To get a clearer picture of what residential air quality actually looks like, Airscan monitored a one-bedroom apartment in Brussels over seven days, tracking CO2, VOCs, and PM2.5 across both the bedroom and the integrated living room and kitchen.
The three pollutants and why they matter
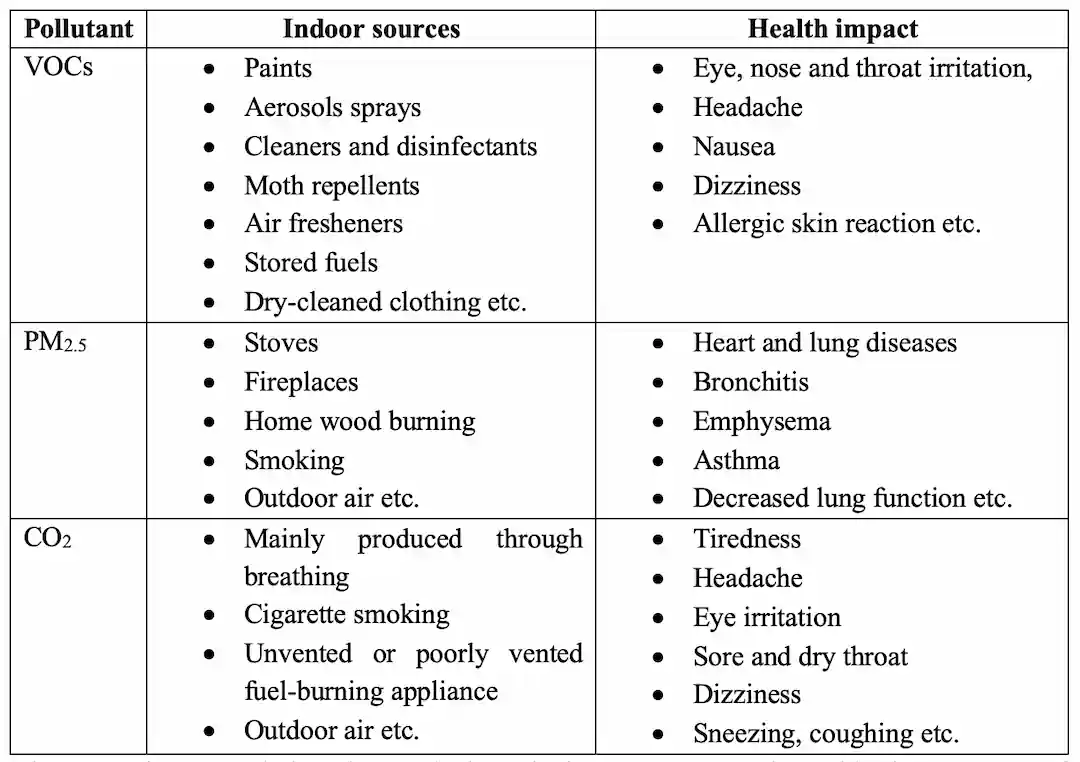
CO2, VOCs, and PM2.5 were chosen because they represent three distinct pollution pathways – respiratory output, chemical off-gassing, and particulate generation – each with different sources and different implications for health.
Carbon dioxide at elevated indoor concentrations is primarily an indicator of inadequate ventilation rather than a direct toxin at typical residential levels, though high CO2 is reliably linked to reduced concentration and headaches. Volatile organic compounds – emitted by everything from cleaning products to personal care sprays, often at concentrations up to ten times higher indoors than outdoors – carry both immediate and cumulative health risks. PM2.5, fine particulate matter with a diameter of 2.5 micrometres or smaller, is the most directly harmful of the three; particles at this size penetrate deep into the respiratory system and can enter the bloodstream, with effects that accumulate over time.
The apartment and how monitoring was set up
The apartment sits on the third floor of a building in the commune of Jette, positioned in an internal courtyard rather than facing a road. It has a bedroom of 38.3 m³ and an integrated living room and kitchen of 95 m³. During the monitoring period, one occupant lived there on a standard office schedule, away from the apartment between 9:00 and 17:00 on weekdays.
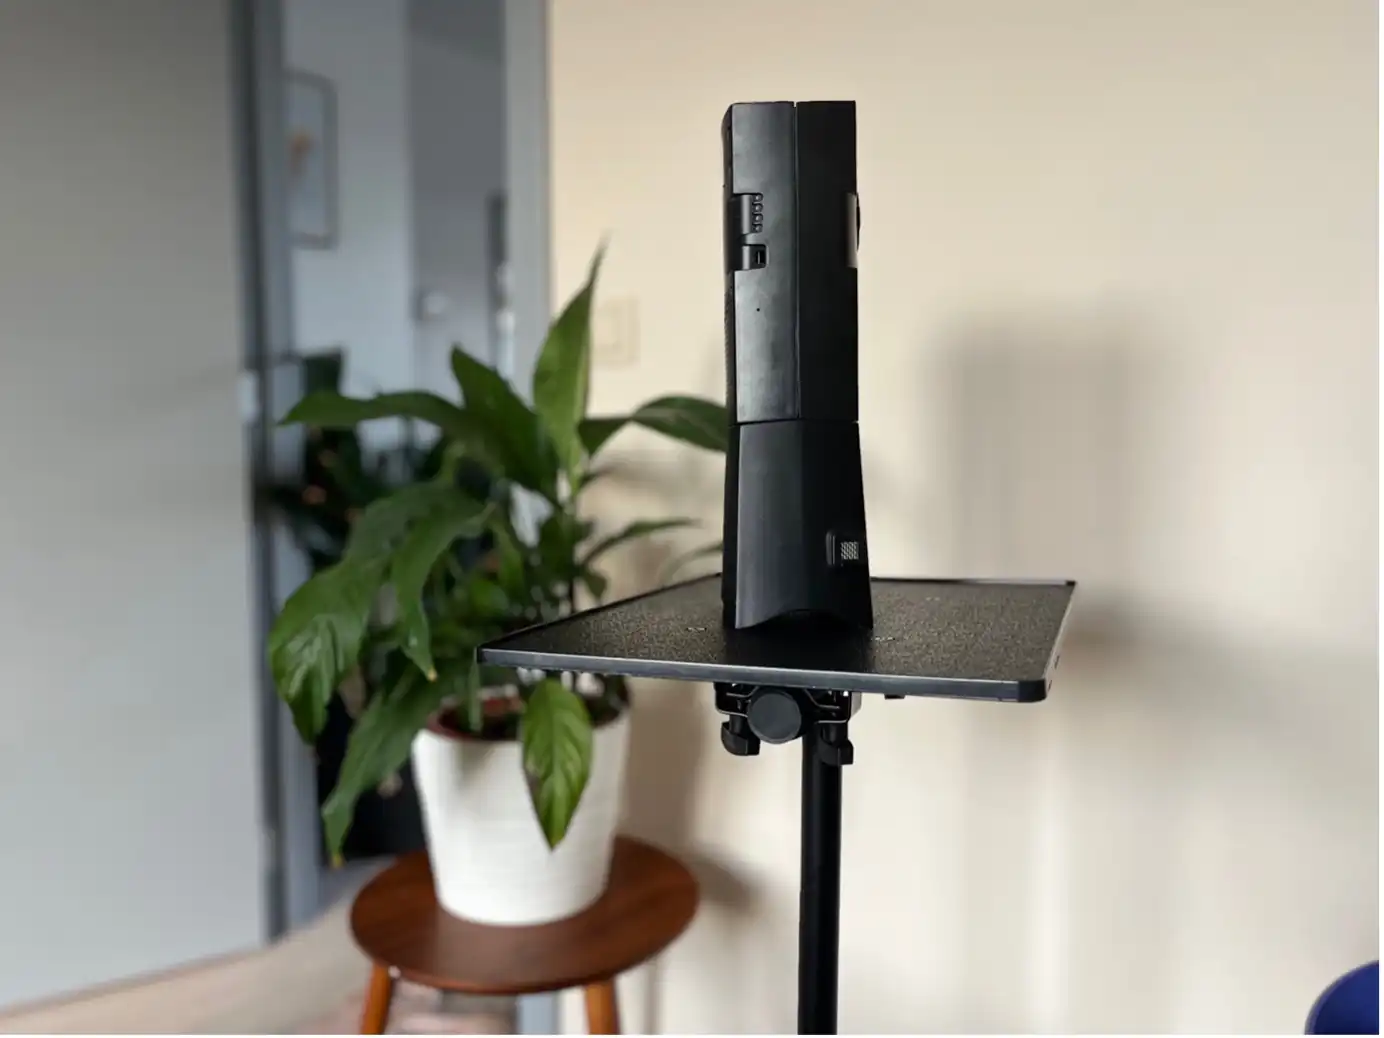
Sensors were placed in both rooms at approximately 1.5 metres above floor level and ran continuously for seven days.

Average levels stayed within thresholds – the peaks are where the story is
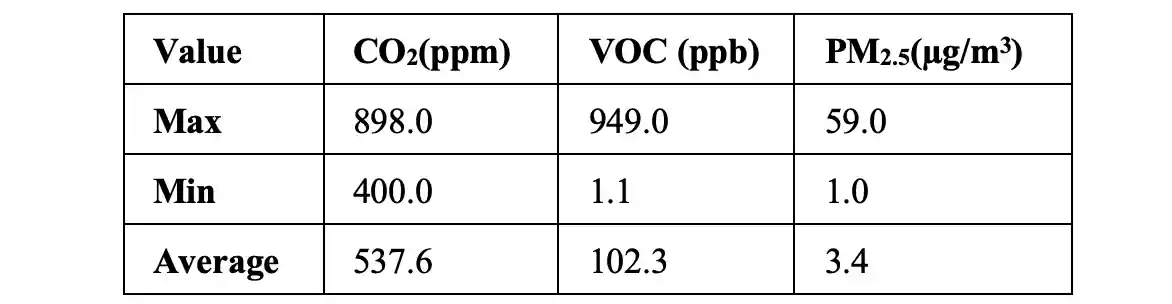
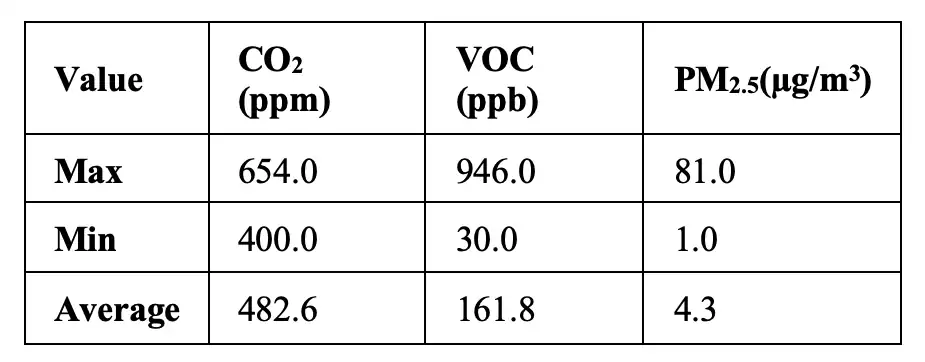
Across both rooms, average concentrations for all three pollutants remained within accepted limits: below the WHO 2021 24-hour threshold of 15 μg/m³ for PM2.5, below 900 ppm for CO2, and below 265 ppb for VOCs. On a weekly average basis, the apartment’s air quality was within range.
The more informative picture comes from the hourly data, which shows where and when concentrations spiked – and why.
What the bedroom data showed
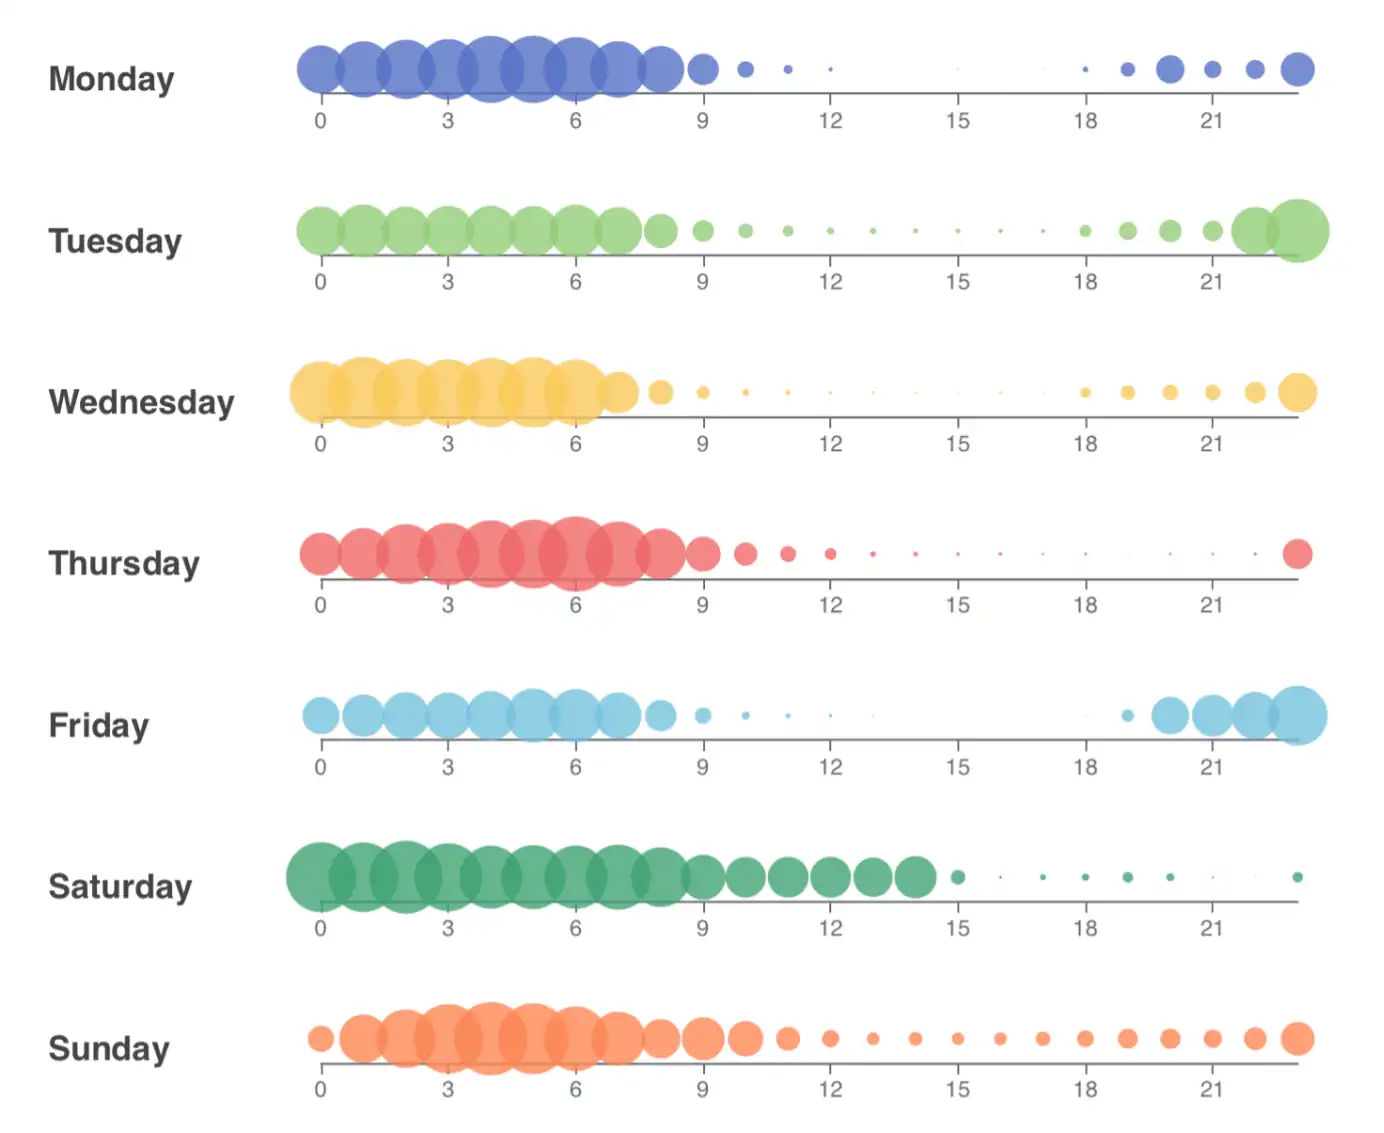
CO2 in the bedroom followed a predictable pattern: levels climbed through the night as the occupant slept with windows closed and dropped sharply once windows were opened or the apartment was vacated during the day. The bedroom is smaller and has one person breathing in it for eight or more hours at a stretch, which makes it the space most vulnerable to CO2 accumulation.
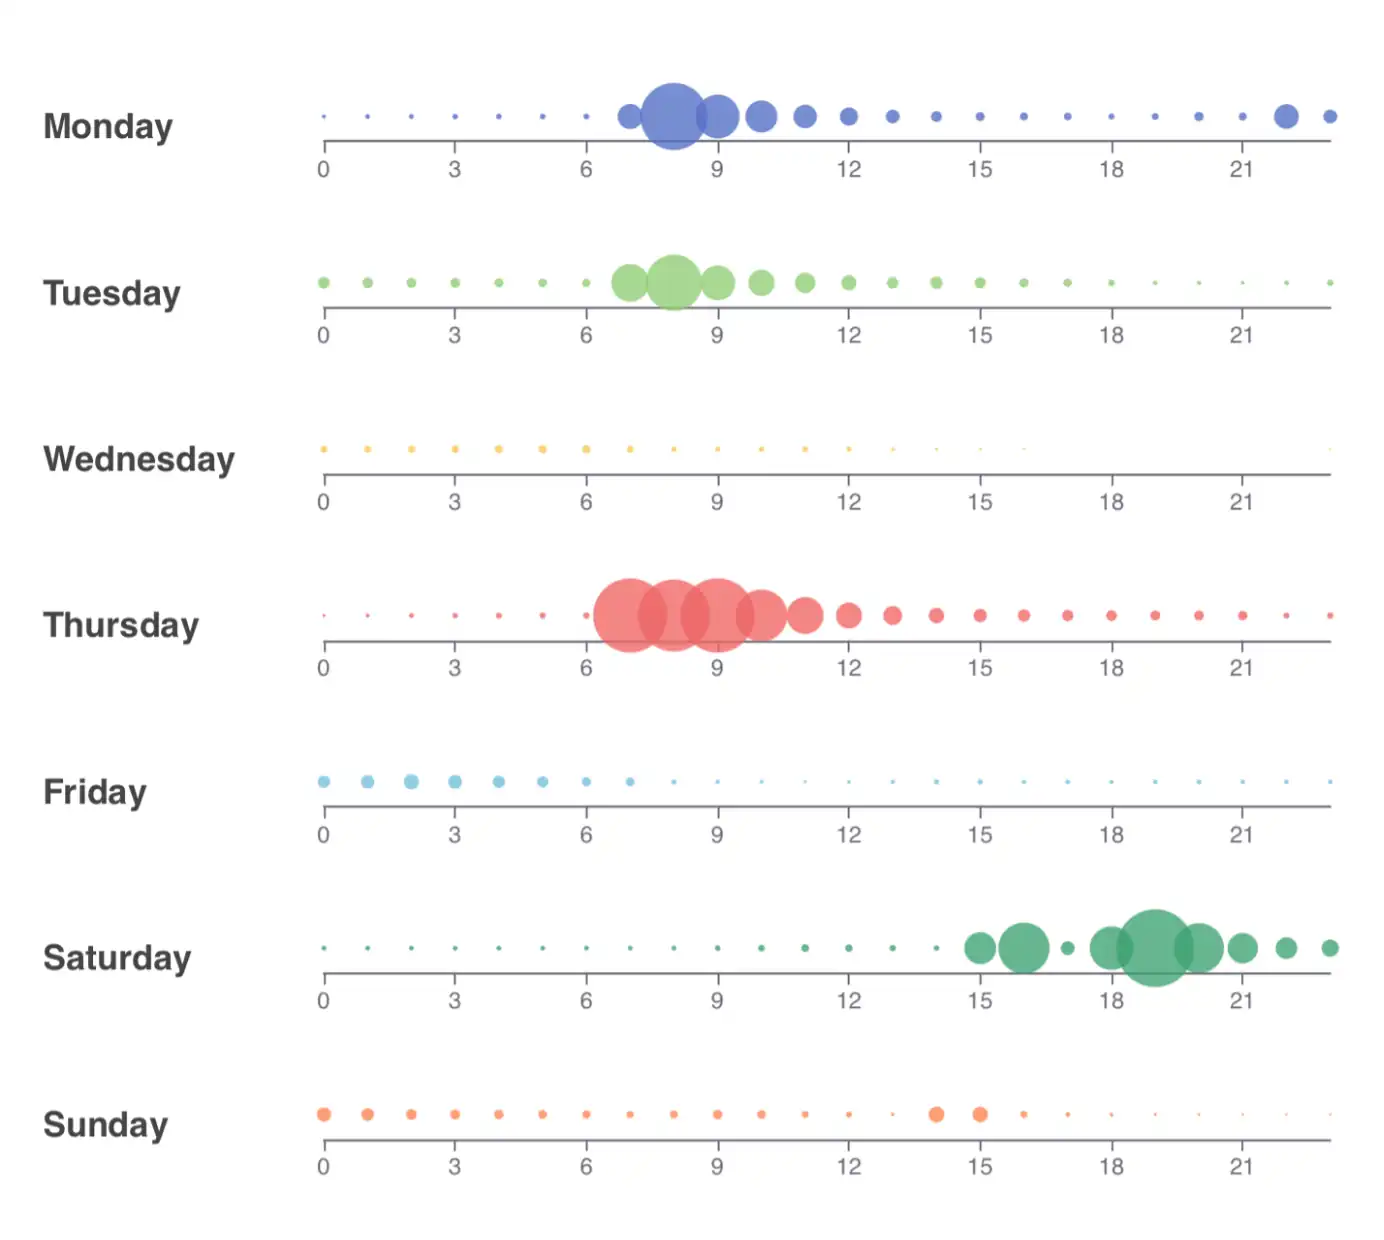
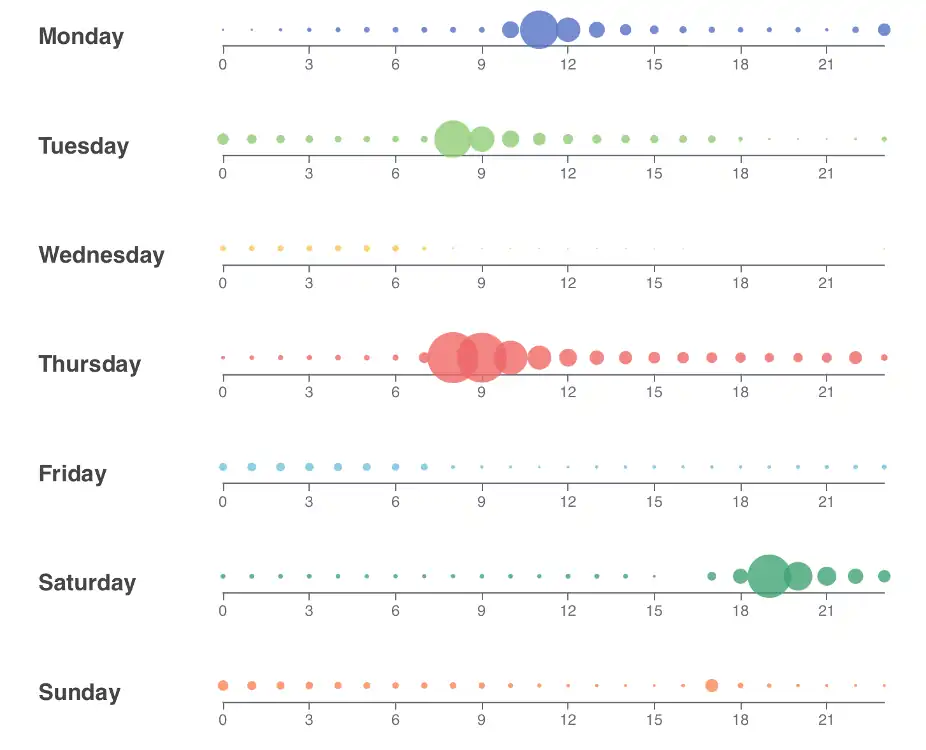
VOC peaks in the bedroom tracked closely with morning routines – perfumes, hairsprays, and deodorants were the dominant sources, with spikes appearing consistently at the same time of day.
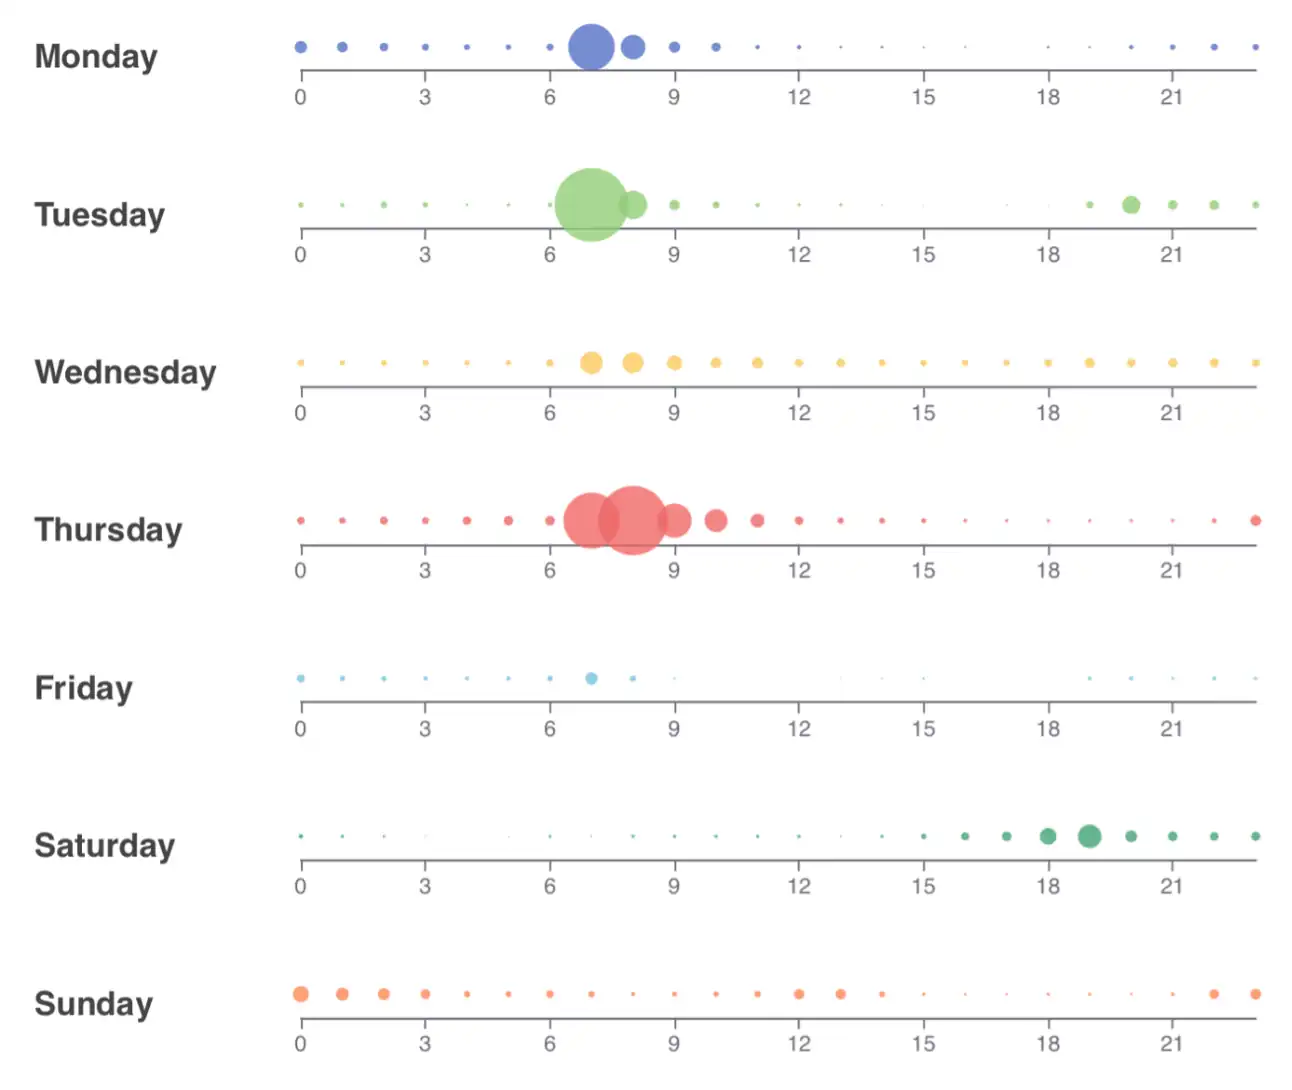
PM2.5 peaks in the bedroom were tied to physical activity rather than any single product: making the bed, getting up, and general movement resuspended settled particles, producing short, sharp spikes in the morning. On days when the apartment was empty – Thursday and Saturday in the dataset – no resuspension was observed.
What the living room and kitchen data showed
CO2 patterns in the living room followed a similar logic to the bedroom, with morning accumulation falling off once a window was opened in the afternoon. The larger volume of the room meant concentrations were generally lower than the bedroom for comparable occupancy.
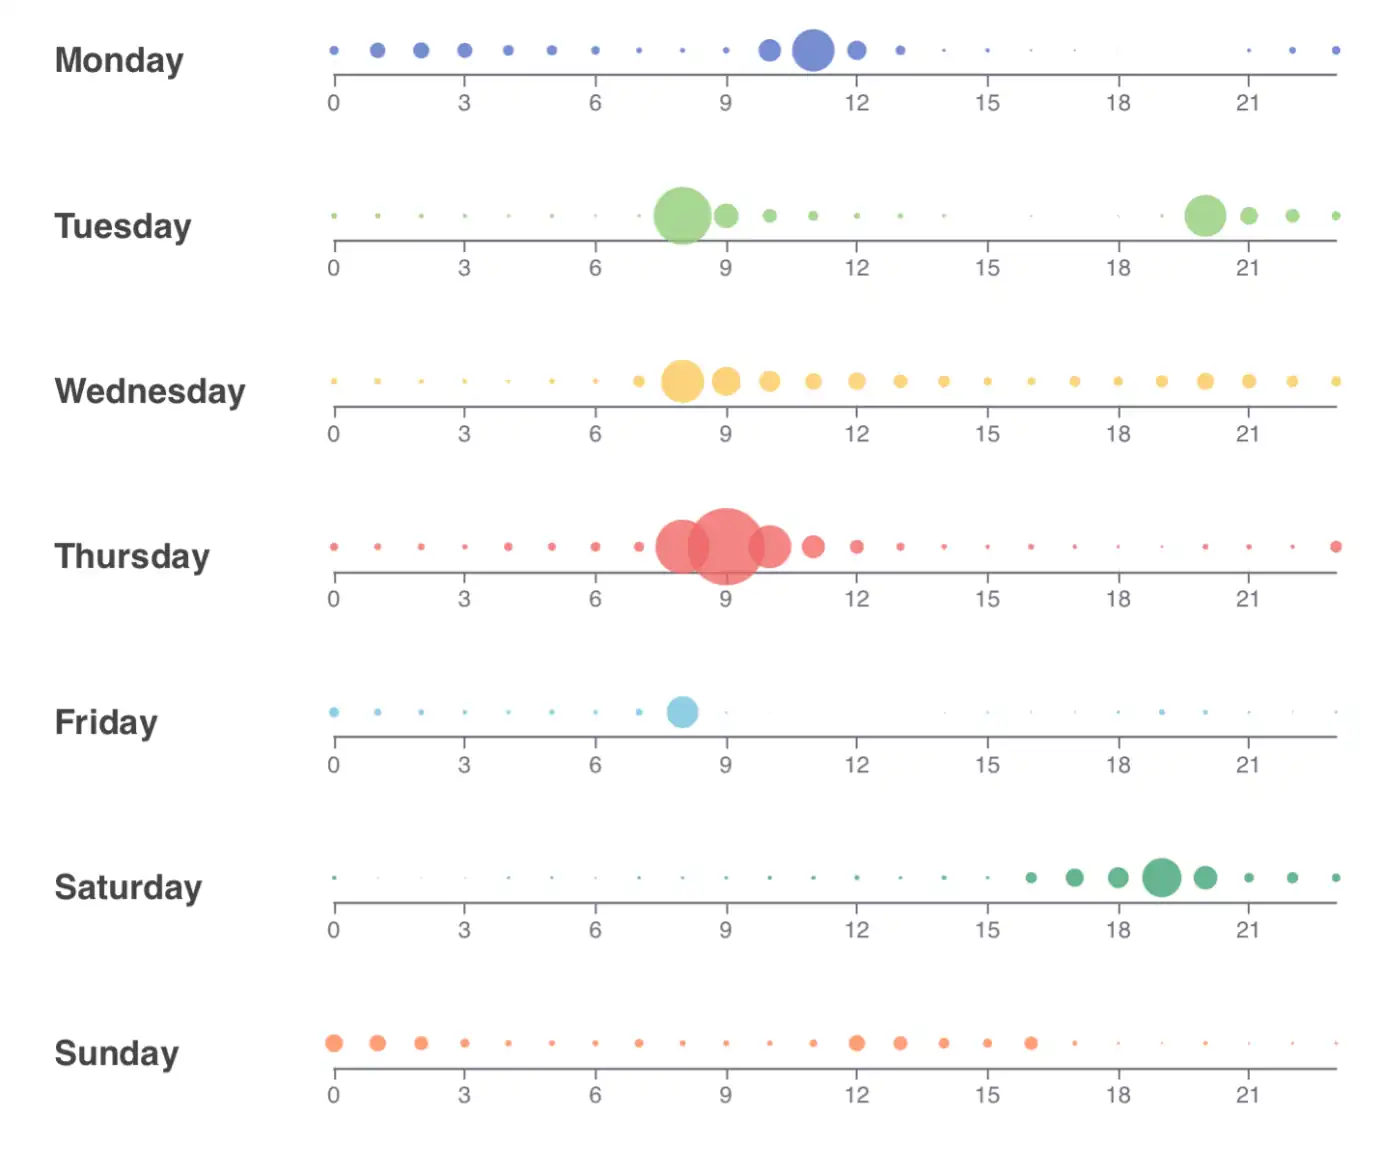
VOC peaks in the living room occurred at almost the same times as those in the bedroom, suggesting the source – cosmetic sprays and cleaning products – was dispersing across both spaces simultaneously rather than staying localised.
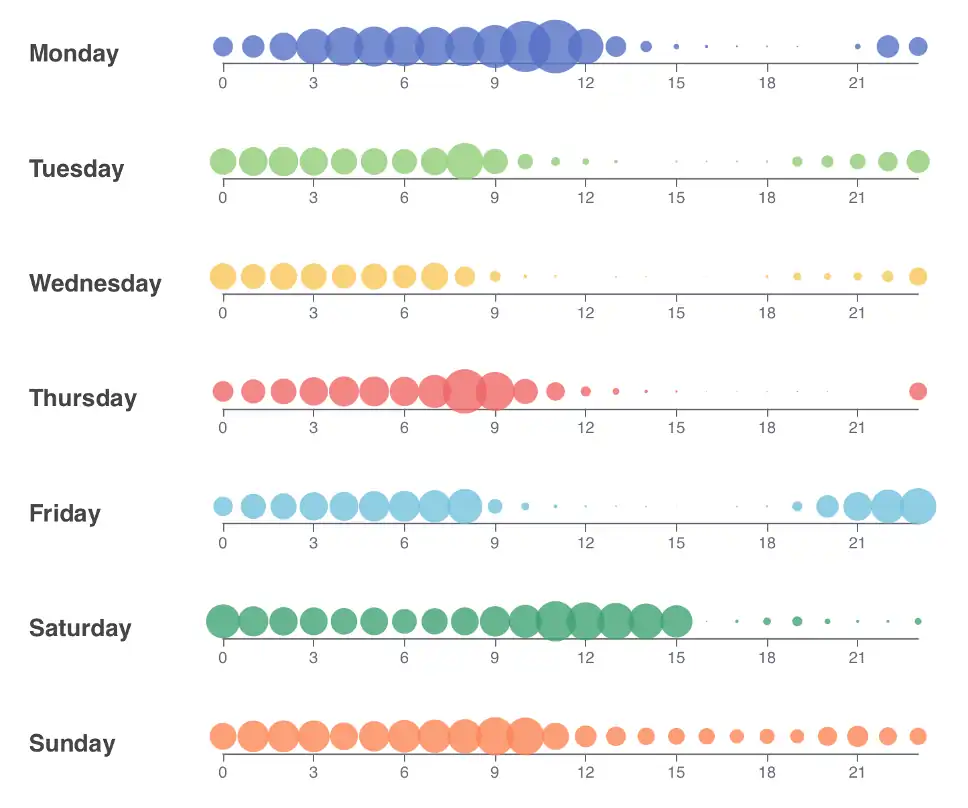
PM2.5 in the kitchen and living room told a different story from the bedroom. Cooking – particularly frying, grilling, and boiling – was the primary driver of elevated concentrations, with high-temperature cooking producing combustion particles from oil and fats that pushed readings up sharply during evening meal preparation.
What the data suggests for how you manage a residential space
The overall finding is that residential air quality in a well-situated Brussels apartment, occupied by one person with standard habits, stays within acceptable average limits – but activity-driven peaks happen regularly, and they’re predictable enough to address directly.
For the kitchen and living room, the most effective interventions are ventilation during cooking, using lids on pots to reduce particulate release, and keeping the cooker hood filter clean. Choosing boiling and steaming over frying where possible makes a measurable difference to PM2.5 levels. Houseplants can absorb some pollutants at the margins, though they’re not a substitute for ventilation and need to be maintained carefully to avoid adding moisture-related problems.
For the bedroom and bathroom, the highest-leverage changes are ventilating when applying sprays and cosmetics, keeping a window slightly open during sleep to prevent CO2 from climbing, and reducing aerosol use in general. Swapping aerosol products for non-aerosol alternatives cuts VOC exposure without requiring any change to routine.
For apartments near busy roads, timing ventilation to avoid peak traffic hours is worth the small inconvenience – outdoor pollution drawn in through open windows can offset the indoor gains entirely, as the Clean Air for Schools monitoring project found when classrooms were kept open throughout the day.