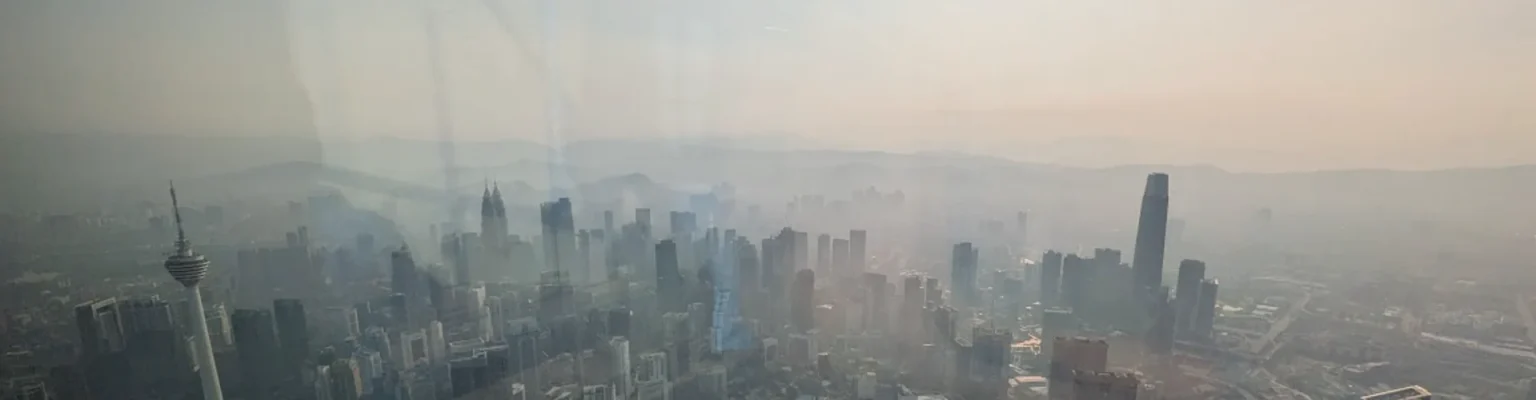
Around 6.6 million people die every year from air pollution, most of them from cardiovascular disease, respiratory disease and lung cancer. The WHO’s global air quality guidelines (AQG) set the pollutant concentrations at which that toll begins to climb, and the current version was published on 22 September 2021 after fifteen years of new mortality evidence.
Click here to jump to the WHO air quality standards table, which sets out the 2021 guidelines alongside the 2005 values they replaced.
What the guidelines say, and where each number came from
The 2021 update covers six pollutants: fine and coarse particulate matter (PM2.5 and PM10), ozone, nitrogen dioxide, sulfur dioxide and carbon monoxide. Every AQG level is the lowest ambient concentration at which the pollutant’s link to a specific health outcome still shows in the epidemiology evidence WHO reviewed.
PM2.5 got a substantial revision. The 2021 annual guideline is 5 µg/m³, half the 2005 value of 10 µg/m³, because long-term studies of non-accidental mortality now show a link at exposures well below what the earlier evidence could resolve. Cause-specific evidence on circulatory disease and lung cancer supports the same threshold at high certainty, with non-malignant respiratory mortality supporting it at moderate certainty. Alongside the annual level sits a 24-hour guideline of 15 µg/m³ (down from 25 in 2005), set at the 99th percentile of the daily distribution that corresponds to the annual level and backed by daily-mortality evidence.
PM10 sits at 15 µg/m³ annually (down from 20) and 45 µg/m³ over 24 hours (down from 50), both derived from mortality studies through the same method. Because PM10 by mass typically contains 50–80% PM2.5, the annual PM10 guideline is less protective than the annual PM2.5 one, and WHO says directly that PM2.5 should govern wherever both pollutants can be measured.
Ozon carries two levels, and the peak-season level of 60 µg/m³ is new to 2021. It applies to the six consecutive months of the year with the highest running-average ozone concentration, calculated as the average of daily 8-hour maxima, and was derived from long-term studies of all non-accidental mortality with supporting evidence on respiratory mortality. The 24-hour level of 100 µg/m³ (as a daily 8-hour maximum) was re-evaluated in 2021 and confirmed at the 2005 value, backed by short-term all-cause mortality studies and reinforced by data on asthma hospitalisations and emergency-room visits.
Nitrogen dioxide was cut hardest. The annual guideline dropped from 40 µg/m³ in 2005 to 10 in 2021, the largest proportional revision in the update, on the strength of long-term evidence tying NO2 to all non-accidental mortality and respiratory mortality. A new 24-hour level of 25 µg/m³ came from daily all-cause mortality studies backed by evidence on daily asthma hospital admissions. The 1-hour guideline of 200 µg/m³ was not re-evaluated in 2021 and remains in force from the earlier updates.
Sulfur dioxide is the only pollutant whose 24-hour guideline moved upward, from 20 µg/m³ in 2005 to 40 µg/m³ in 2021, after WHO re-derived it using updated methodology and daily-mortality evidence. The 10-minute guideline of 500 µg/m³ was not re-evaluated and remains valid.vel of 500 µg/m³, protecting against acute respiratory symptoms, was not re-evaluated and remains valid.
Koolmonoxide gained a new 24-hour guideline of 4 mg/m³, derived from short-term studies of myocardial infarction hospital admissions and emergency-room visits. Three earlier CO guidelines remain in force: 10 mg/m³ over 8 hours, 35 mg/m³ over 1 hour and 100 mg/m³ over 15 minutes.
For black carbon and elemental carbon, ultrafine particles and dust-storm particles, WHO issues qualitative good-practice statements and recommends systematic measurement and further research, as the epidemiology needed to define thresholds is not yet clear.
WHO air quality standards table (2005 vs 2021)
| Pollutant | Averaging time | WHO 2005 | WHO 2021 |
|---|---|---|---|
| PM₂.₅ | Annual | 10 µg/m³ | 5 µg/m³ |
| 24-hour | 25 µg/m³ | 15 µg/m³ | |
| PM₁₀ | Annual | 20 µg/m³ | 15 µg/m³ |
| 24-hour | 50 µg/m³ | 45 µg/m³ | |
| O₃ | Peak season (six-month running average of daily 8-hour maxima) | Not set | 60 µg/m³ |
| 8-hour daily maximum | 100 µg/m³ | 100 µg/m³ | |
| NO₂ | Annual | 40 µg/m³ | 10 µg/m³ |
| 24-hour | Not set | 25 µg/m³ | |
| 1-hour | 200 µg/m³ | 200 µg/m³ | |
| SO₂ | 24-hour | 20 µg/m³ | 40 µg/m³ |
| 10-minute | 500 µg/m³ | 500 µg/m³ | |
| CO | 24-hour | Not set | 4 mg/m³ |
| 8-hour | 10 mg/m³ | 10 mg/m³ | |
| 1-hour | 35 mg/m³ | 35 mg/m³ | |
| 15-minute | 100 mg/m³ | 100 mg/m³ |
Interim targets and what each rung costs in mortality
For pollutants revised in 2021, WHO also publishes interim targets as staging posts for places where reaching the AQG level in one step is unrealistic. The number of targets varies by pollutant, from four rungs for the particulates down to one for CO.
Each rung carries a mortality index calibrated to 100 at the AQG level. Every point above 100 represents additional deaths in that population attributable to the higher pollutant concentration, drawn from the cardiovascular, respiratory and lung-cancer endpoints on which the AQG was derived.
For annual PM2.5, the index sits at 124 at IT-1 (35 µg/m³), 116 at IT-2 (25 µg/m³), 108 at IT-3 (15 µg/m³) and 104 at IT-4 (10 µg/m³, the 2005 AQG). Many of the world’s most polluted urban areas sit at or above IT-1 today, and WHO’s index says that moving those places to the AQG would cut population mortality by roughly a fifth. The four-point gap between the 2005 and 2021 AQGs represents the low-concentration health effects that WHO’s evidence review picked up in the fifteen years between updates.
Long-term PM10 runs 102, 106, 114 and 122 from IT-4 to IT-1, drawing on the same cardiovascular and respiratory endpoints. Annual NO2 sits at 102, 104 and 106 across IT-3 (20 µg/m³) to IT-1 (40 µg/m³) for all-cause mortality, and at 103, 106 and 109 for respiratory mortality, where the NO2 evidence base is strongest for COPD. Peak-season ozone sits at 101 and 104 across IT-2 (70 µg/m³) and IT-1 (100 µg/m³) for all-cause mortality, and at 102 and 108 for respiratory mortality, which is the outcome the peak-season metric was built around.
The index assumes a linear concentration-response function. WHO notes that at higher concentrations the function may no longer be linear, which would shift the numbers.
Whether the guidelines are legally binding
WHO’s Global Air Quality Guidelines 2021 aren’t legally binding. That said, WHO publishes them as evidence-informed recommendations, and national and regional governments reference the AQG to write binding air quality standards respectively. Standards vary widely in strictness. Most sit above the AQG level, often at an interim target. The EU’s revised Ambient Air Quality Directive, Directive 2024/2881, sets a 2030 annual PM2.5 limit of 10 µg/m³, which matches WHO IT-4 and sits at twice the AQG value. WHO tracks how national standards line up with the guidelines through its Air Quality Standards tool, and progress against the AQG levels is one of the SDG indicators WHO reports on.
WHO air quality guidelines that apply to indoor environments
WHO wrote the 2021 guidelines to apply in indoor and outdoor environments alike. But occupational settings are the exception and tend to sit under a separate regulatory framework built around occupational exposure limits (OELs). OELs are usually set by national labour authorities such as
Occupational settings are the exception, because workplaces sit under a separate regulatory framework built around occupational exposure limits (OELs). For example, OELs in the EU come from the Chemical Agents Directive 98/24/EC transposed by national labour ministries, while in Malaysia they come from from the USECHH Regulations 2000 enforced by the Department of Occupational Safety and Health. OELs typically run substantially higher than the WHO AQGs for the same pollutant, in that they assume an 8-hour workday and a 40-hour week among a healthy adult workforce covered by labour law, while the WHO’s AQGs cover continuous exposure across the full population, including children, older people and people with pre-existing conditions.
Alongside the 2021 update, WHO publishes a separate indoor air quality series covering pollutants and conditions distinctively indoor. The series has three volumes. Selected pollutants (2010) covers benzene, carbon monoxide, formaldehyde, naphthalene, nitrogen dioxide, polycyclic aromatic hydrocarbons, radon, trichloroethylene and tetrachloroethylene. Dampness and mould (2009) covers biological contamination indoors. Household fuel combustion (2014) sets emissions targets for cooking and heating fuels. All three remain the current WHO indoor guidelines, and no 2024 update has been issued.
What WHO’s Air Quality Guidelines do not cover
The AQG define single-pollutant levels. WHO does not publish recommendations on pollutant mixtures or combined effects, because the review-level epidemiology still runs mostly on single-pollutant models. WHO does write that meeting all the AQG levels simultaneously is what population health actually requires, since everyday exposure is always to a mixture.
The guidelines also do not prescribe policies or interventions to reach the levels. WHO leaves implementation to national and local governments on the reasoning that what works in one setting may not work in another. Personal interventions like masks, respirators and air purifiers are covered in a separate WHO document, Personal interventions and risk communication on air pollution (2020).
Where things stand in 2026
WHO first issued air quality guidelines for Europe in 1987 and updated them in 2000. A global update followed in 2006, based on the conclusions of WHO’s October 2005 working group in Bonn, and work on the current version began in 2016, drawing on systematic reviews commissioned into a special issue of Environment International. The guidelines were published on 22 September 2021.
In March 2025 WHO convened the Second Global Conference on Air Pollution and Health in Cartagena, Colombia. More than 50 countries, cities and organisations committed to cutting the health impact of air pollution by 50% by 2040. The commitments sit on top of the 2015 World Health Assembly resolution WHA68.8 and the SDG framework, which folds air pollution into indicators 3.9.1 (mortality from ambient and household air pollution), 7.1.2 (population access to clean fuels and technologies) and 11.6.2 (annual mean PM2.5 in cities).
In June 2026 WHO released the eighth version of its Ambient Air Quality Database, which now covers 8,024 human settlements across 127 countries. Later the same month, on 29 June, WHO published updated SDG data on ambient and household air pollution. Global population-weighted PM2.5 fell steadily until 2020 and has been flat since, WHO reports, with low- and middle-income countries carrying substantially higher exposures than high-income ones. WHO classifies the gap as a critical inequality.
Applying these guideline levels to a project in Europe or Asia? Visit our Indoor Air Quality Testing En Binnenluchtkwaliteitsmonitoring pages for more information.