Underground transit is a peculiar air quality problem. You’re in an enclosed space, sharing it with dozens or hundreds of other people, while trains moving through tunnels generate their own pollution through wheel-rail friction, brake wear, and the vacuum effect that draws outdoor air – and whatever’s in it – straight into the station. Airscan measured PM2.5 and PM10 at six stations along Brussels’ first metro line in July 2024, and the findings are worth understanding if you commute through the city regularly.
Where metro particulate matter comes from
PM2.5 and PM10 refer to particulate matter by aerodynamic diameter – particles smaller than 2.5 and 10 micrometres respectively. Both categories are regulated by the WHO because particles at these sizes penetrate the respiratory system; PM2.5 in particular can reach the lungs and enter the bloodstream. In metro environments, the sources are fairly specific: braking generates friction between wheels and rails, producing coarse particles; electric sparks from contact systems contribute finer PM2.5; and the pressure wave that a train creates moving through a tunnel draws in outdoor air, carrying whatever particulate matter is present outside into the station with it. Construction work and general human movement add to the baseline.
The Brussels metro runs four lines across 69 stations, with the average commuter spending around 20 minutes on a one-way trip – long enough for cumulative exposure to matter.
WHO thresholds and why the 2021 update matters
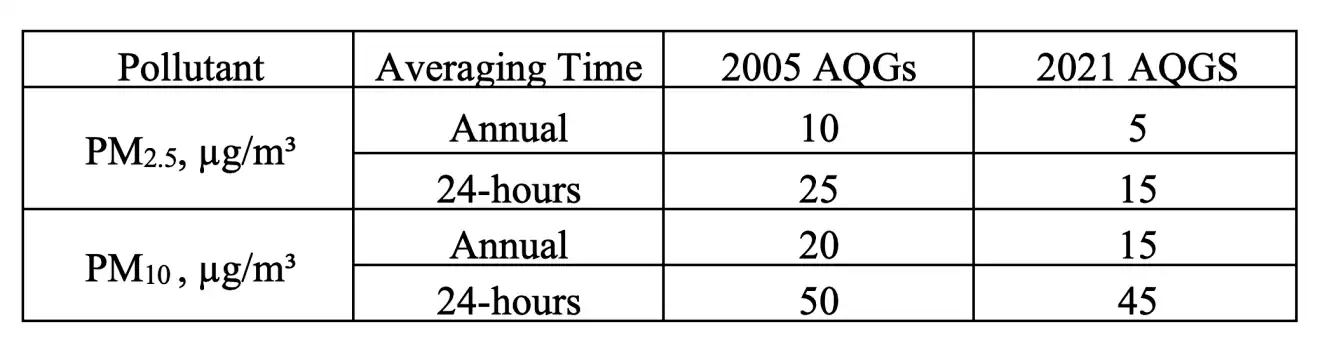
The WHO revised its air quality guidelines in 2021, tightening the thresholds for both PM2.5 and PM10 based on accumulated evidence of harm at lower concentrations than the 2005 limits had assumed.
What the measurements showed across six stations
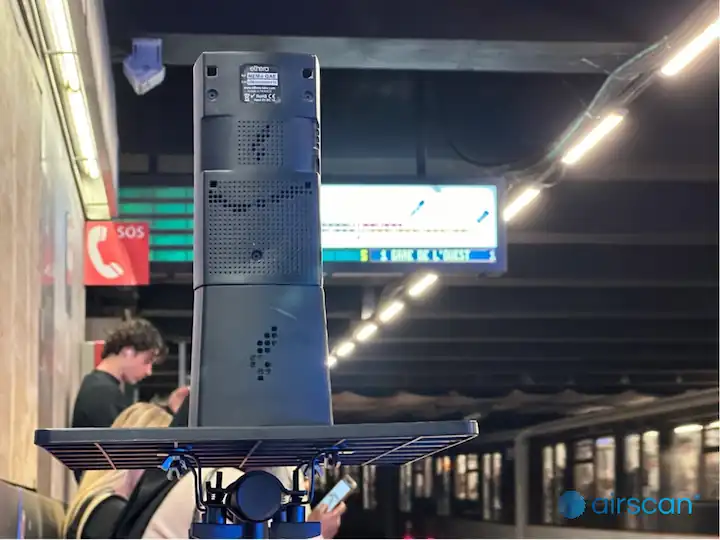
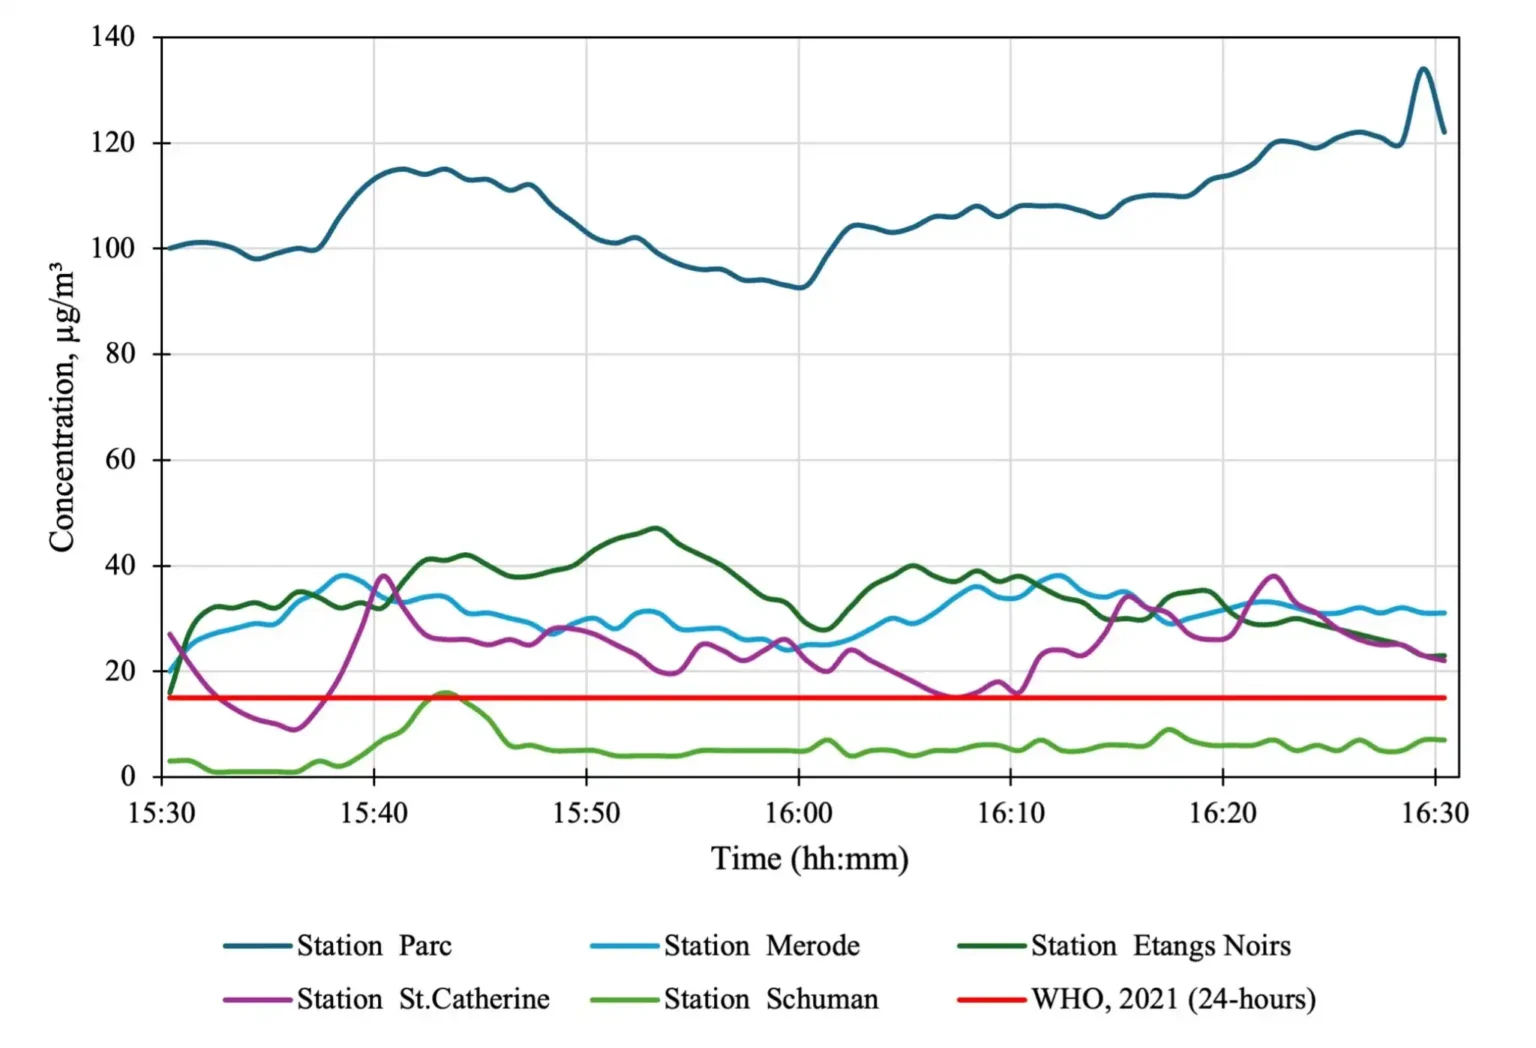
On 1 July 2024, Airscan assessed air quality at six stations on Line 1: Etangs Noirs, Sainte-Catherine, Parc, Gare Centrale, Schuman, and Merode. Measurements were taken over one hour between 15:30 and 16:30.
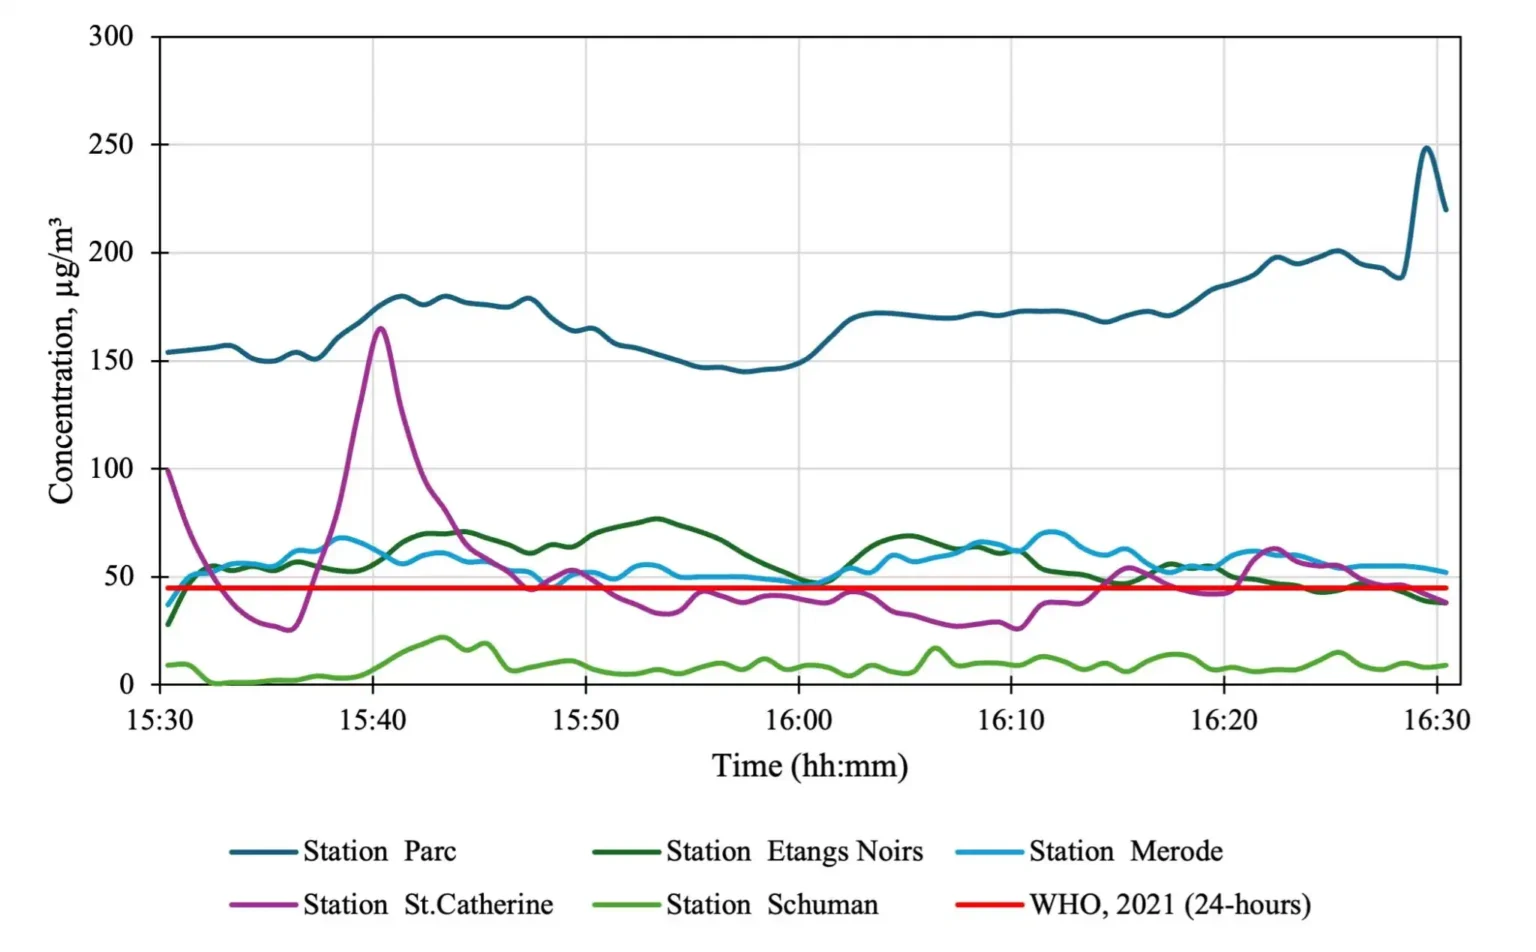
The most immediate finding was the relationship between PM2.5 and PM10 at these stations. Across all six locations, PM10 concentrations were consistently higher than PM2.5, with an average ratio of 1.6 between the two – a clear indication that coarse particles dominate the particulate load in Brussels metro air, consistent with the mechanical sources typical of rail environments.
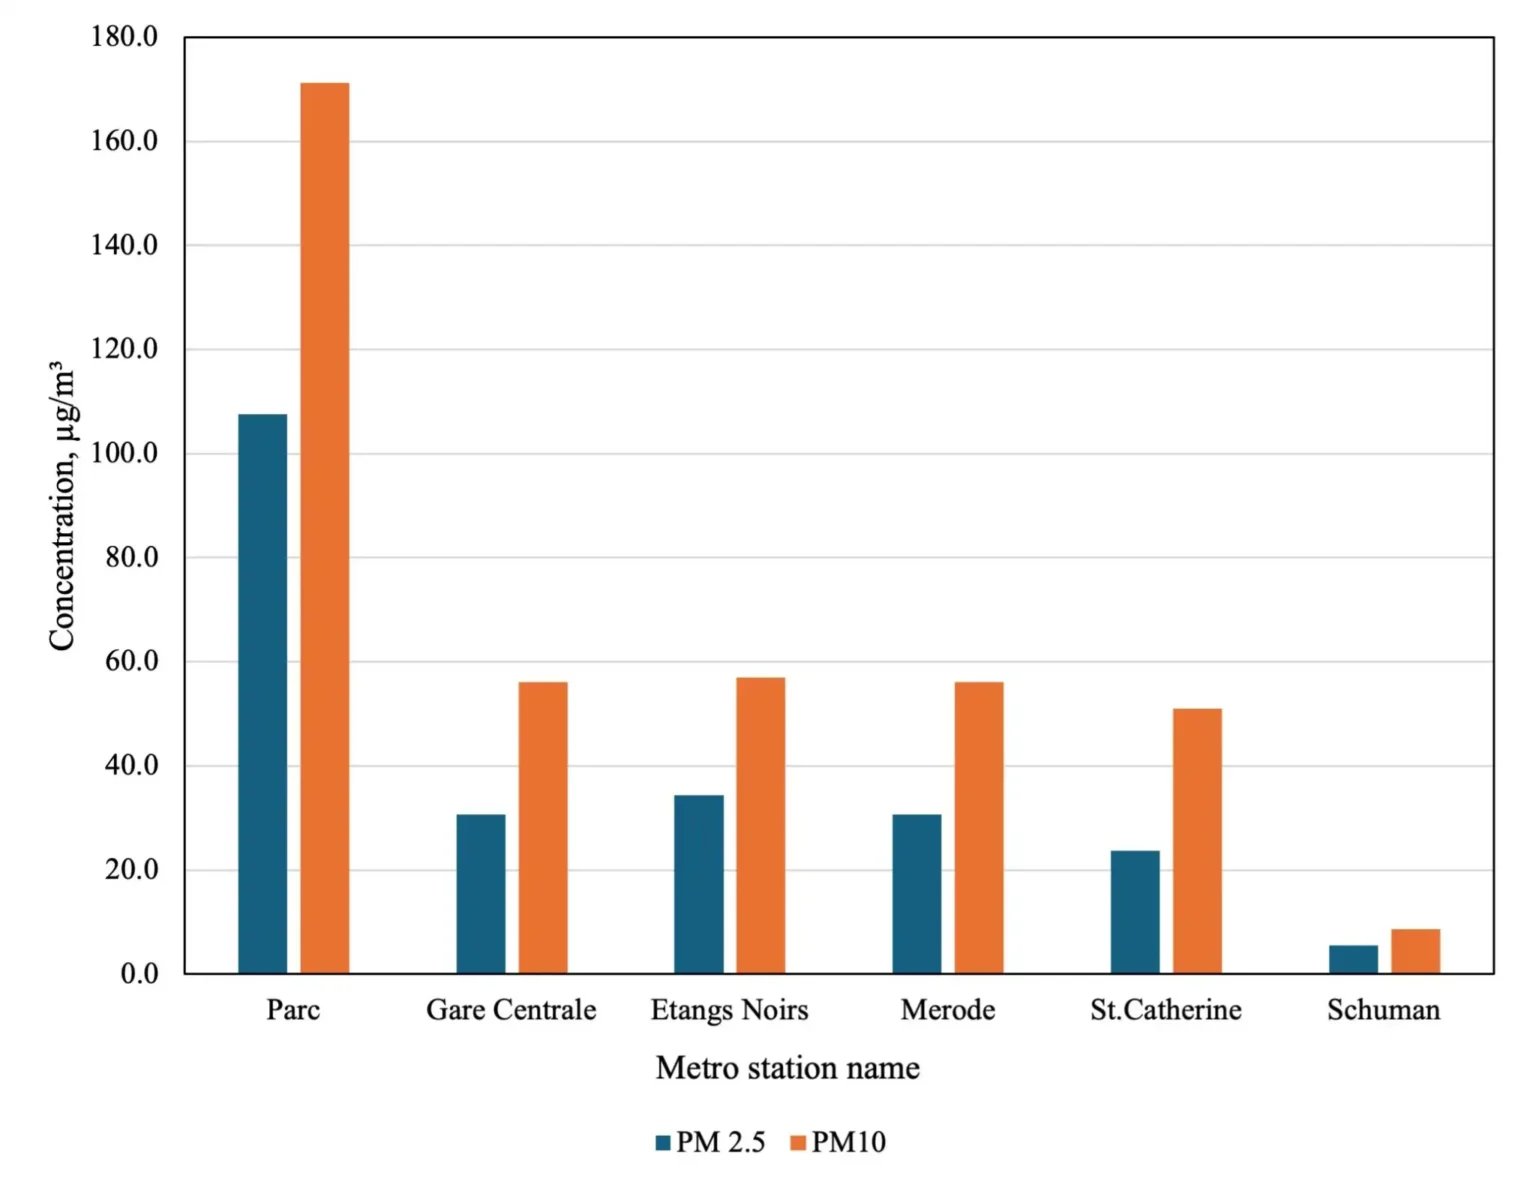
Four out of the five stations where PM2.5 was fully evaluated exceeded the WHO 2021 24-hour threshold of 15 μg/m³, with brake and wheel wear identified as the primary source. Poor ventilation in certain stations compounds the issue, allowing particulate matter to accumulate rather than disperse.
PM10 told a similar story, with all stations except Schuman exceeding the WHO 2021 24-hour limit of 45 μg/m³. Parc station recorded the highest PM10 levels of the group, largely attributable to intensive construction activity ongoing at the time of measurement. Schuman’s comparatively better performance is linked to recent renovations and additional exits that have improved air exchange through the station.
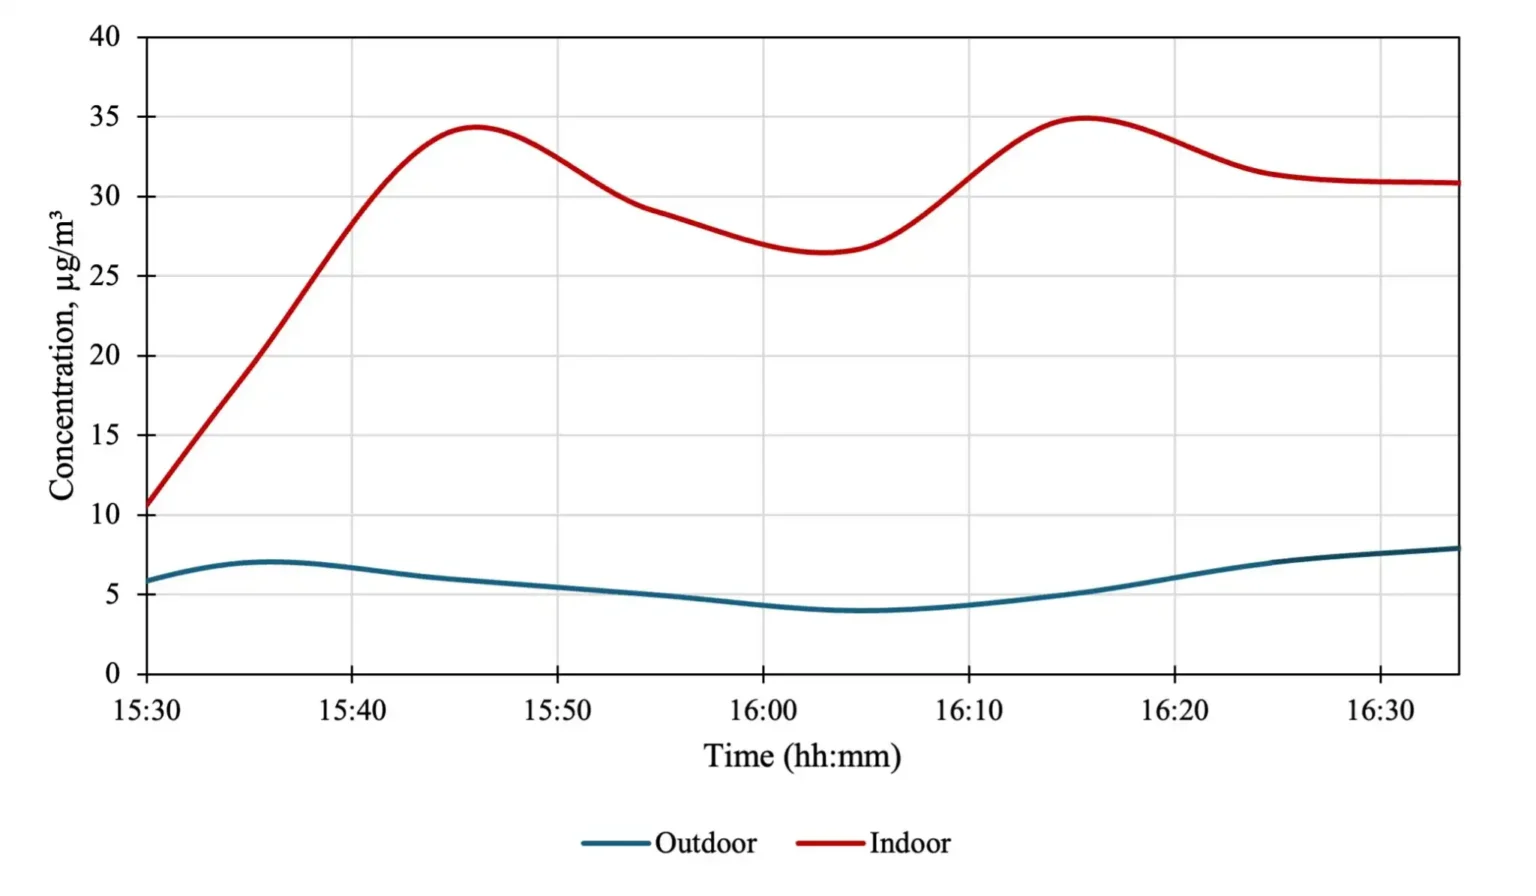
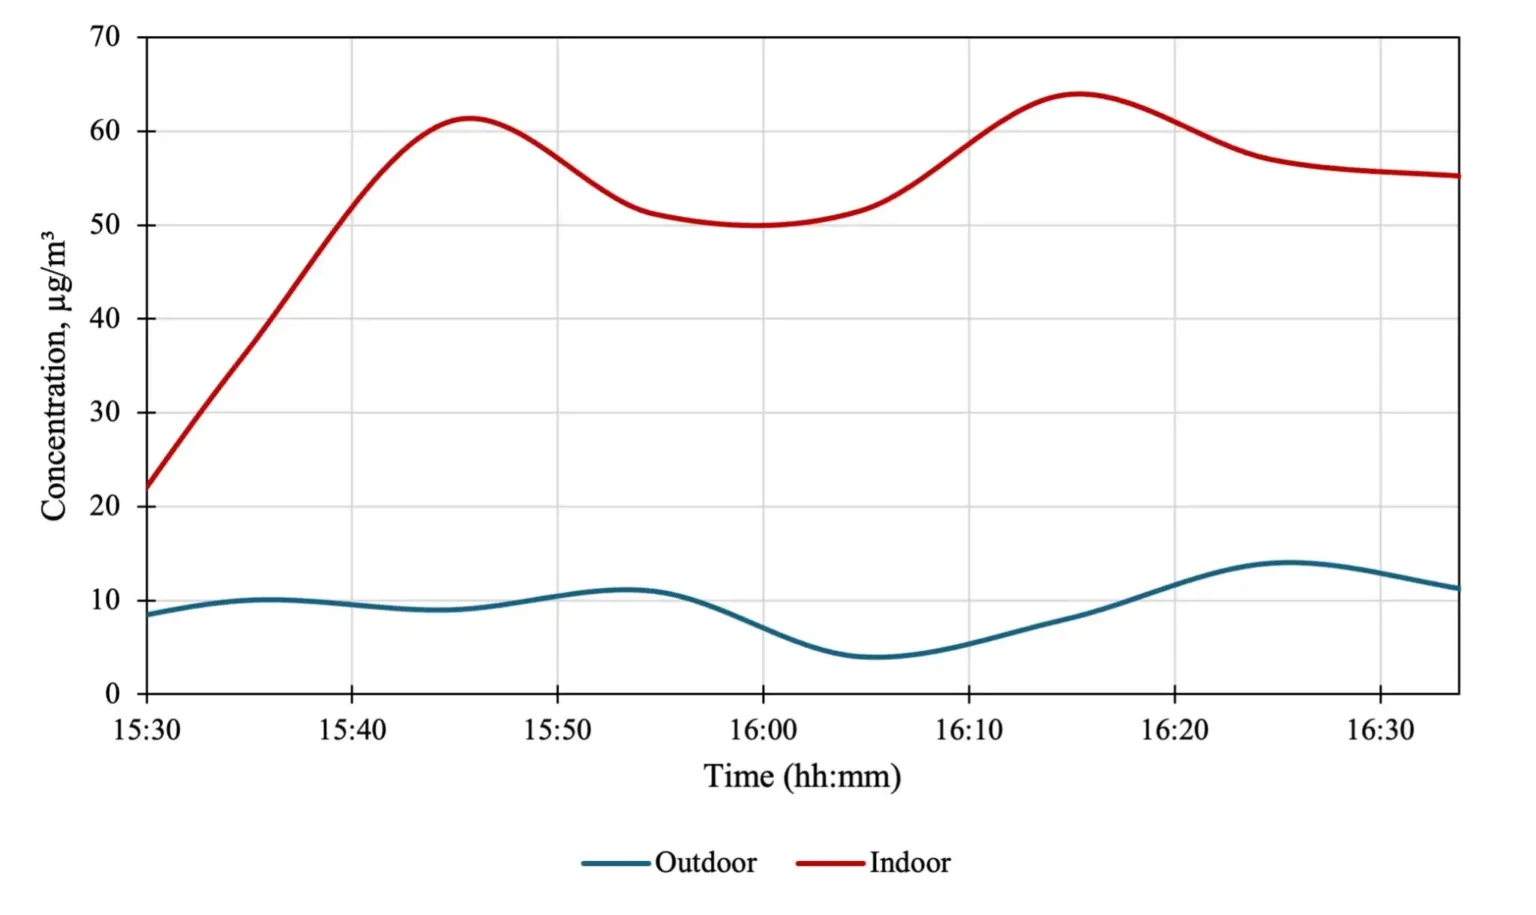
Indoor versus outdoor at Gare Centrale
To examine the relationship between station air and street-level air, Airscan also compared indoor and outdoor PM2.5 and PM10 readings at Gare Centrale. Indoor concentrations were significantly higher than outdoor at the same location – a result of the enclosed environment, ongoing construction, and limited ventilation at that station during the measurement period. Outdoor air, spread across a larger area and influenced by wind and other meteorological factors, distributes particles more widely; those same conditions don’t apply underground.
What can actually be done
Reducing particulate exposure in metro environments requires action at the infrastructure level rather than individual behaviour alone. Enhanced ventilation systems that actively bring in fresh air and expel polluted air make the most direct difference. Regular cleaning with vacuum systems – rather than methods that resuspend settled dust – keeps baseline levels lower between peak periods. Using lower-emission brake materials reduces one of the primary pollution sources at the point of generation. Installing continuous monitoring systems allows operators to identify problem stations, track trends, and respond to spikes rather than discovering issues after the fact.
For individual commuters, particularly those with respiratory conditions, real-time air quality data and masks during high-traffic periods are practical steps while infrastructure improvements work through longer planning cycles.