Over two weeks in February, Airscan ran a city-wide air quality campaign across Brussels, placing sensors in eight municipalities simultaneously and logging readings every ten minutes. The goal was straightforward: get a clear, comparable picture of pollution levels across different parts of the capital, focusing on PM2.5, PM10, and NO2 – three pollutants with well-established health thresholds and well-documented sources.
Why city-level air quality monitoring matters
The WHO attributed 6.7 million premature deaths globally in 2019 to pollution exposure. More than half the world’s population now lives in urban areas, a figure projected to reach 68% by 2050 – which means the quality of air in cities is increasingly the quality of air that most people breathe for most of their lives. Brussels, as a dense, high-traffic European capital, is a useful case study precisely because it’s not an outlier; it’s representative of conditions across much of urban Europe.
Where pollution was worst – and why
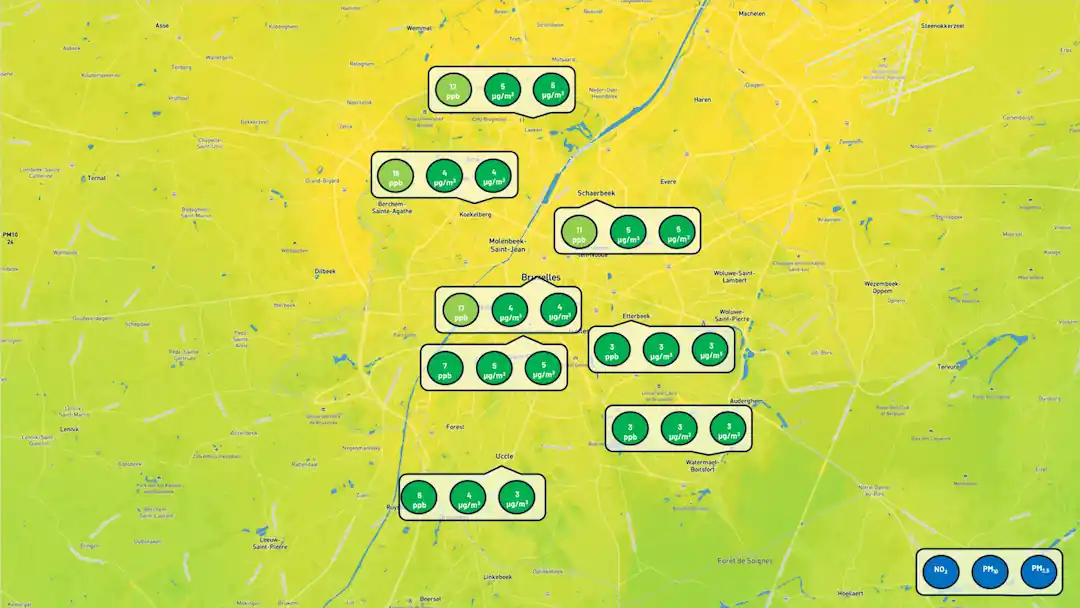
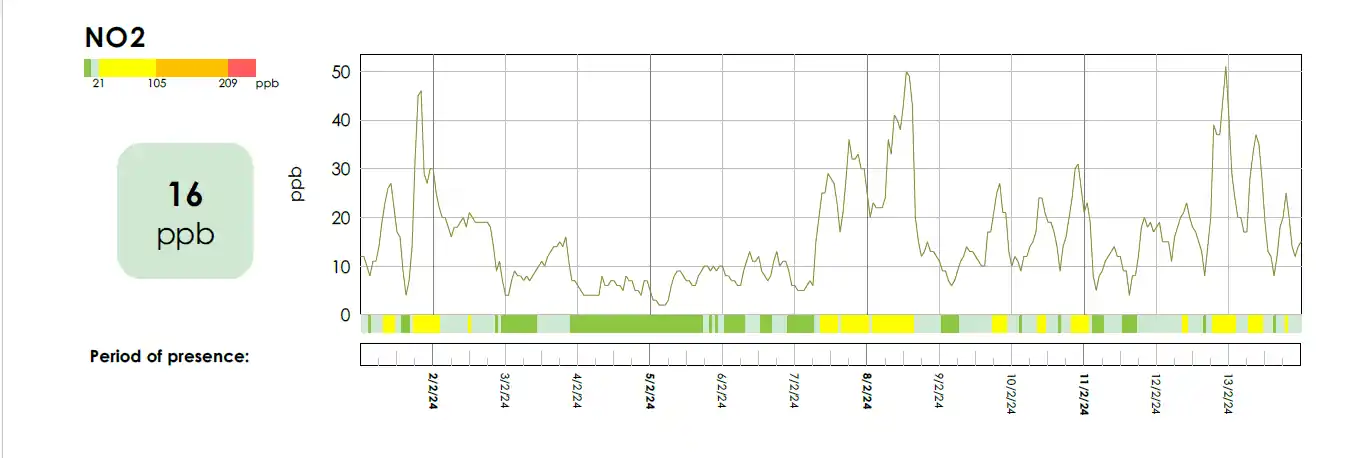
The sensors near Central Station in the city centre and at Simonis in Koekelberg recorded the highest pollution levels of the eight locations, followed by Bockstael in Laeken. At these sites, average NO2 concentrations ran at three times the WHO air quality guideline, with peaks reaching 40 ppb. At the other end of the scale, Watermael-Boitsfort and Etterbeek recorded the lowest NO2 averages – around 3 ppb – with peaks staying below 25 ppb throughout the measurement period.
The gap between the best and worst locations is substantial, and it maps closely onto traffic density. Transportation accounts for 48% of NO2 emissions, which makes the city centre and major interchange points predictable hotspots.
The daily pattern that appeared everywhere
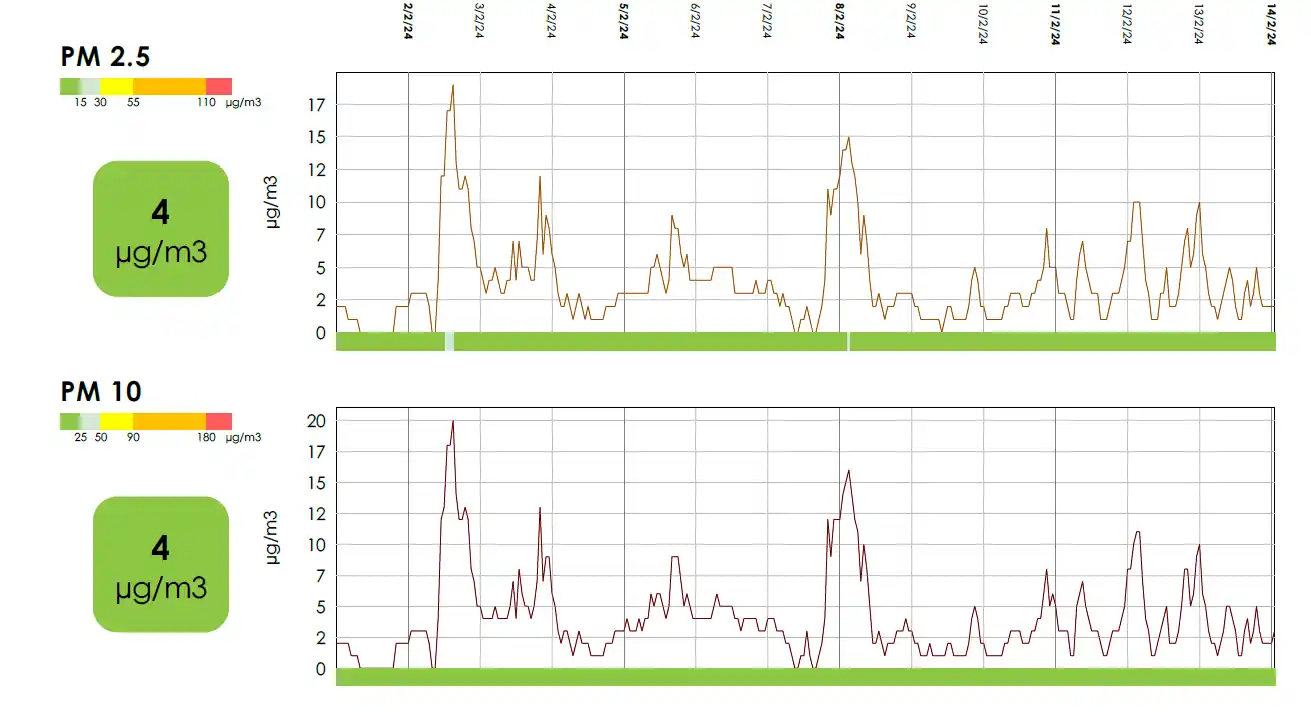
Despite the differences in concentration between municipalities, every sensor showed the same temporal pattern: sharp spikes between 6am and 9am, and again between 4pm and 7pm. The NO2 signature of the morning and evening commute is consistent and pronounced across the city. PM2.5 and PM10 behaved differently – concentrations stayed relatively stable through the day before beginning to rise from around 4pm, a pattern that likely reflects household heating activity in the evening hours alongside the tail end of the commuter peak.
What the campaign confirms
Pollution levels in Brussels have declined over recent years, and that’s worth acknowledging – sustained policy and infrastructure effort has moved the needle. What this campaign shows is that hotspots persist, that their sources are identifiable, and that the gap between current conditions and WHO thresholds remains significant in the most affected areas. Continuous monitoring is what makes that gap visible and actionable, rather than a statistical estimate from periodic spot checks.