Air pollution has moved from a peripheral environmental concern to a structural feature of urban life. Regulation has expanded, measurement has improved, and awareness has grown. Yet one aspect remains poorly understood outside specialist circles: air pollution does not behave consistently across the year. Exposure changes with the seasons, shaped as much by weather as by emissions themselves.
Using data from the Pure Cities programme in Belgium, this article examines how seasonal meteorological conditions influence concentrations of PM2.5, PM10, and nitrogen dioxide (NO2). Temperature, humidity, wind speed, atmospheric pressure, and precipitation all play a role in determining when pollution accumulates, when it disperses, and which pollutants dominate at different times of the year.
Why seasonality matters
Air pollution carries a substantial health and economic burden. Around 90% of the global population is exposed to polluted air daily. This exposure contributes to an estimated seven million deaths annually and imposes societal costs of between €330 and €940 billion per year within the European Union alone. Beyond mortality, polluted air drives the loss of roughly 1.8 billion working days each year, increases childhood asthma incidence, and raises the risk of premature birth.
Urban pollution is driven primarily by fine particulate matter, nitrogen oxides, and volatile organic compounds. These pollutants damage health directly and interact with atmospheric chemistry in ways that accelerate climate warming. Seasonal patterns matter because they determine when these risks intensify—and when mitigation efforts are most likely to be effective.
Measuring real conditions
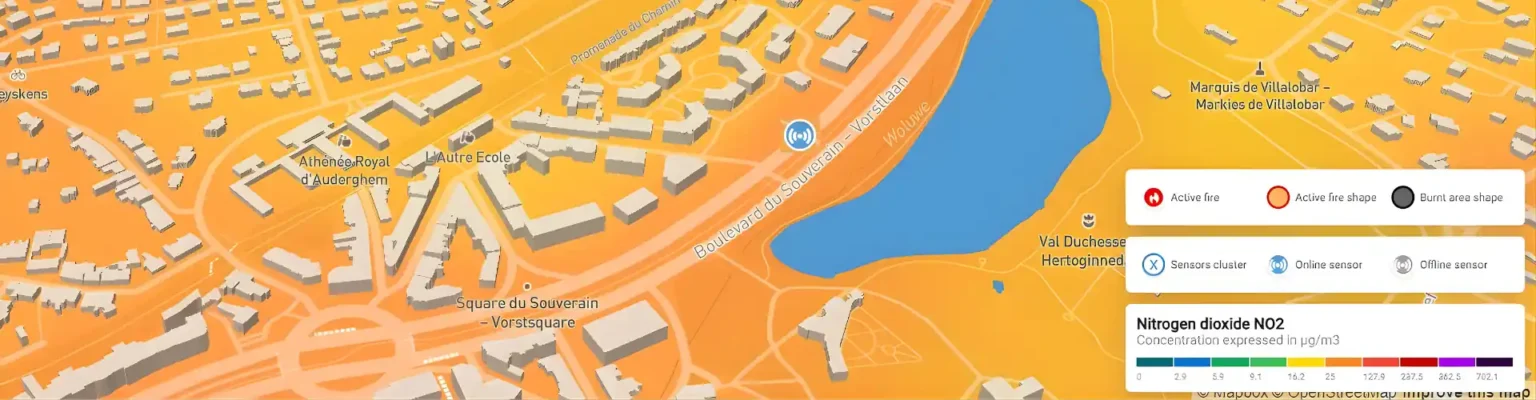
To move beyond assumptions and annual averages, Airscan and Belfius launched the Pure Cities initiative. The programme provides Belgian municipalities with continuous, high-resolution outdoor air quality data, offered free of charge to participating cities. The aim is not only to measure pollution, but to understand how it behaves in real environments over time.
Using advanced sensor networks as part of Airscan’s Air Quality Monitoring services, hourly measurements are collected for PM2.5, PM10, and NO2 over a full year. This continuous approach captures daily cycles, seasonal transitions, and weather-driven fluctuations that short-term campaigns routinely miss.
What the pollutants do
PM2.5 consists of particles small enough to penetrate deep into the lungs and enter the bloodstream. Long-term exposure is associated with respiratory disease, cardiovascular events, impaired lung development in children, and increased mortality risk, particularly among people with pre-existing conditions. Environmentally, PM2.5 reduces visibility, contributes to haze, alters the Earth’s radiation balance, and contaminates soil and water systems.
PM10 includes larger particles that lodge in the upper respiratory tract. Chronic exposure aggravates asthma, contributes to chronic obstructive pulmonary disease, and increases hospitalisation rates. These particles also settle on vegetation, reducing photosynthesis, acidifying soils, and degrading water quality.
Nitrogen dioxide primarily affects the respiratory system, irritating airways and increasing susceptibility to infection. Prolonged exposure reduces lung function and contributes to chronic respiratory illness. NO2 also drives the formation of ground-level ozone and secondary particulate matter, damages buildings and monuments, and plays a central role in acid rain formation.
Weather as a control mechanism
Pollutant concentrations are shaped not only by emissions, but by meteorological conditions that govern dispersion, transformation, and removal. Five parameters are particularly influential: temperature, humidity, atmospheric pressure, wind speed, and precipitation.
Temperature affects both dispersion and chemistry. Higher daytime temperatures generally promote vertical mixing, reducing particulate concentrations near the surface. At the same time, heat and solar radiation accelerate reactions involving nitrogen oxides. During summer, NO2 often breaks down more rapidly under ultraviolet radiation, even as ozone formation increases. This explains why NO2 concentrations tend to fall during warm periods, despite ongoing emissions.
Humidity influences pollutant formation and behaviour in more complex ways. Moist air can suppress the formation of nitrogen oxides, particularly noticeable in spring. At the same time, humidity promotes particle coagulation, which can increase particulate concentrations under certain conditions.
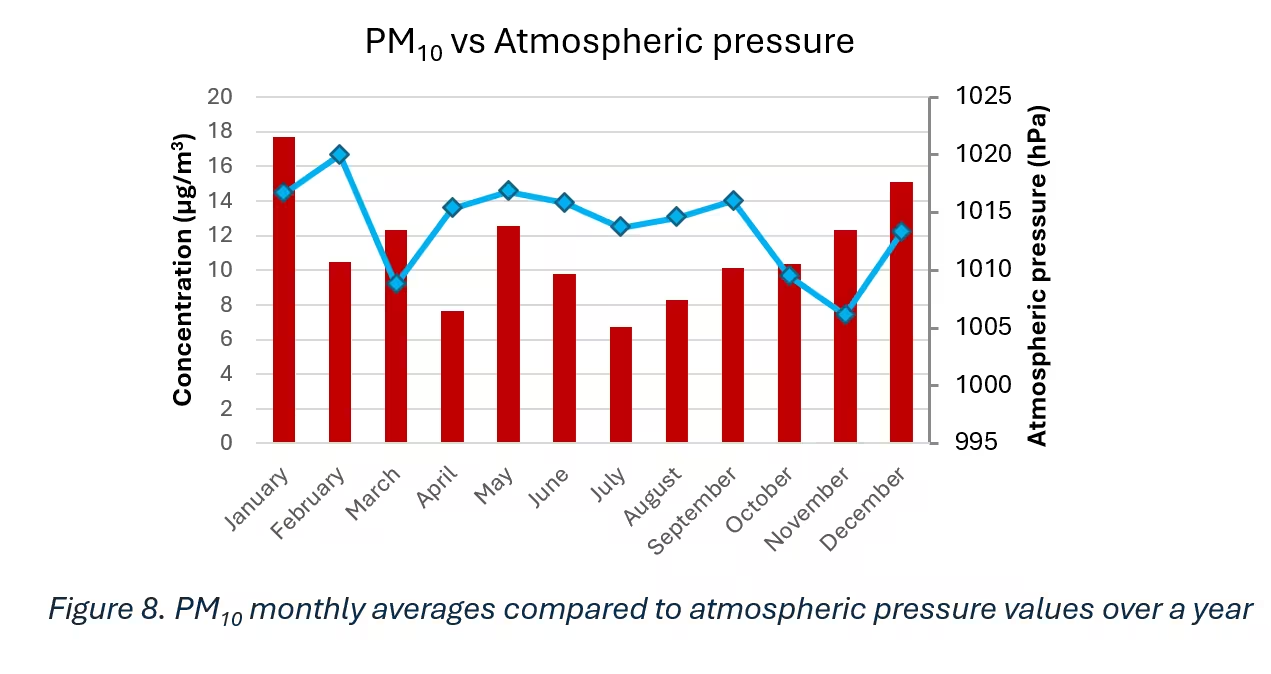
Atmospheric pressure determines whether air masses remain stagnant or mobile. High-pressure systems create stable conditions that trap pollutants close to the ground. These systems are most common in winter and favour the accumulation of particulate matter and NO2, particularly in urban areas.
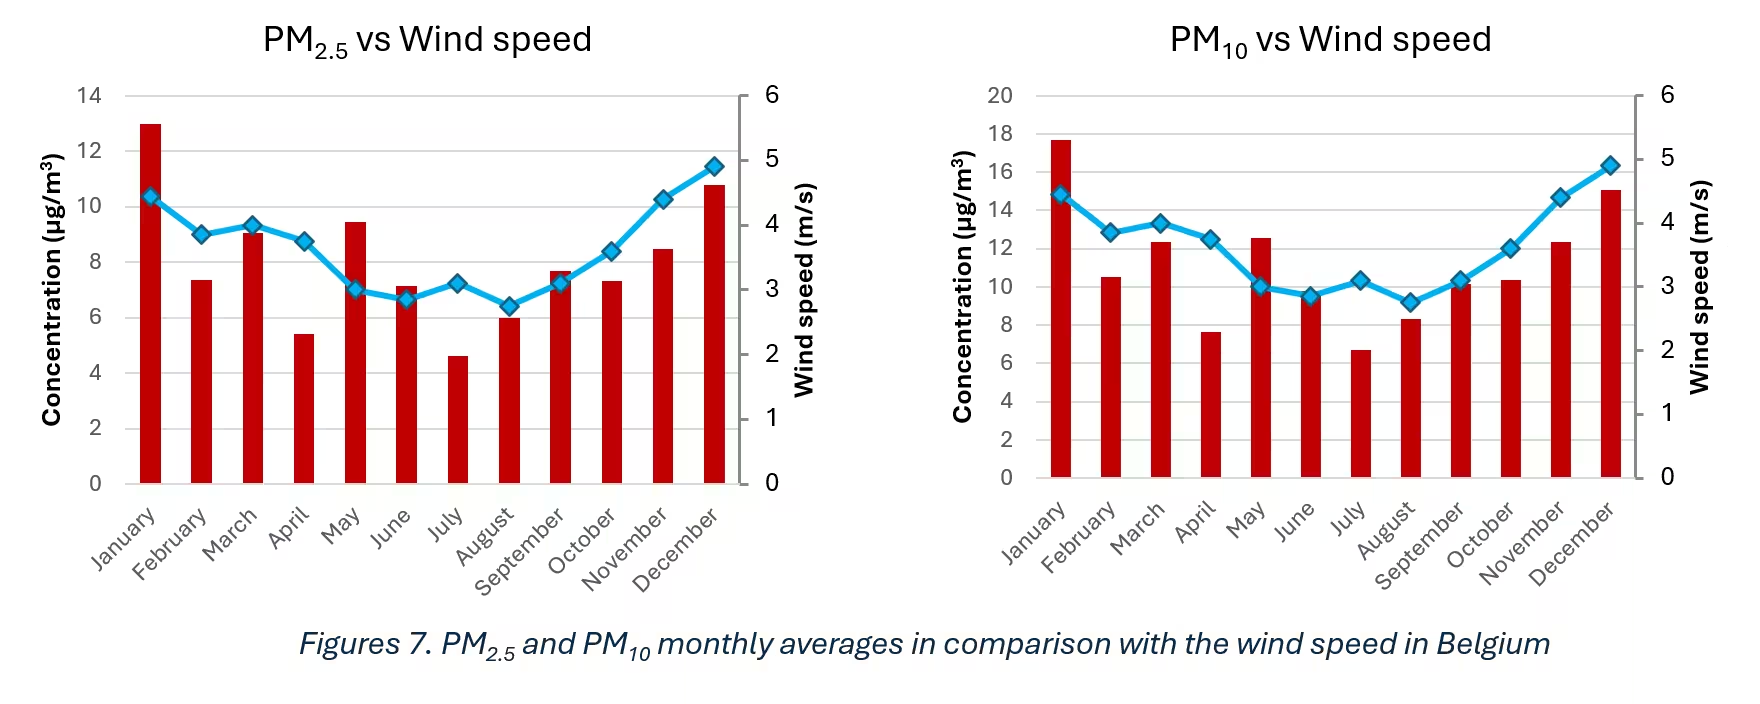
Wind speed has a dual effect. Strong winds can disperse pollutants and reduce local concentrations. Under other conditions, wind resuspends particles, increasing measured PM2.5 and PM10 levels. Wind also enables long-range transport: dust plumes can travel thousands of kilometres, with Saharan dust events periodically affecting Belgian air quality and causing visible deposition and respiratory irritation.
Precipitation removes pollutants through washout. Rainfall in spring and summer often coincides with lower PM2.5 and PM10 concentrations, as airborne particles are captured and removed from the atmosphere. However, precipitation alone does not guarantee cleaner air when other factors—such as emissions or atmospheric stability—dominate.
Belgium’s seasonal context
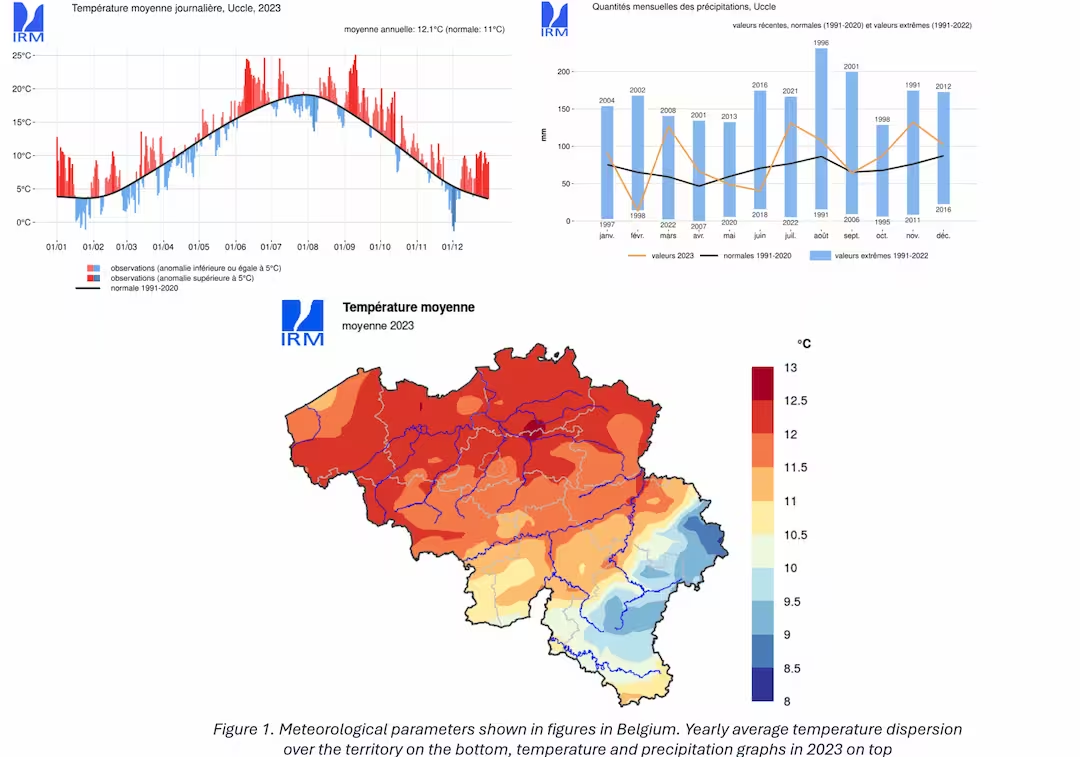
Belgium follows a temperate Northern Hemisphere climate. July and August are typically the warmest months, while December and January are the coldest. Over the past three decades, data from the IRM show that precipitation is highest in autumn and winter and lowest in spring, with rainfall increasing again in summer. In 2024, June and July recorded exceptionally high rainfall.
Belgium sits within the polar front, producing two dominant seasonal wind patterns. South-westerly winds prevail for much of the year, bringing warmer air, while north-easterly winds become more common during seasonal transitions. Wind speeds remain highest along the coast and generally stay below 20 km/h inland.
These conditions create predictable seasonal pollution dynamics, particularly during winter, when low temperatures, high pressure, and limited dispersion coincide.
Regulatory thresholds
The WHO guidelines updated in 2021 set annual thresholds of 5 µg/m³ for PM2.5, 15 µg/m³ for PM10, and 10 µg/m³ for NO2. These values are more stringent than current European Union limits. EU air quality directives still permit concentrations more than twice as high, though revisions are under review with proposed updates expected by 2030.
What the data shows
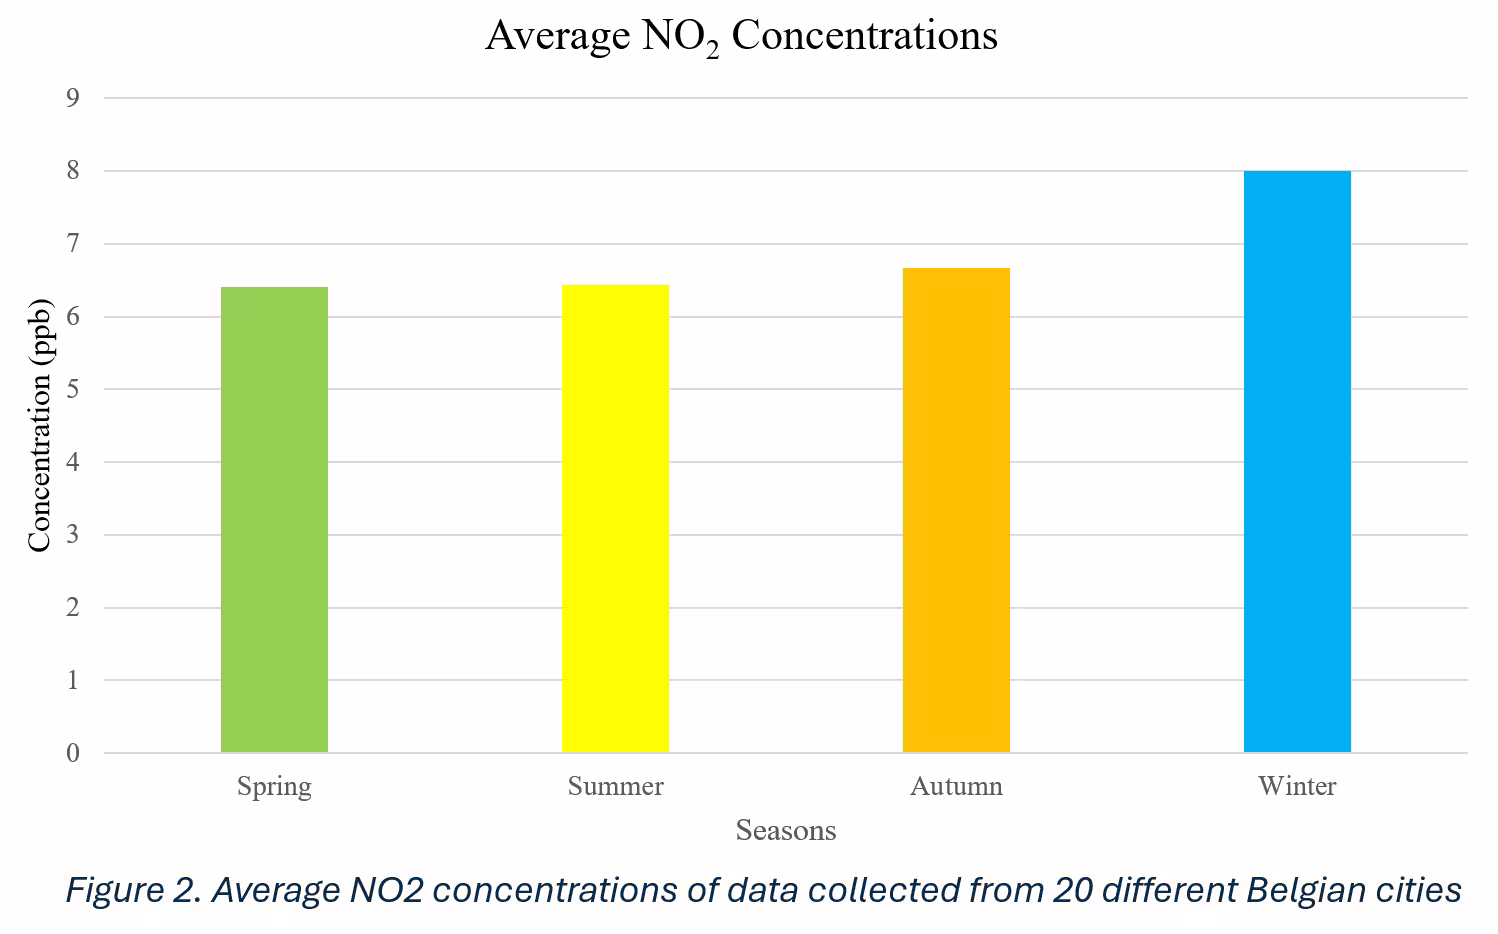
So far, Pure Cities has collected data from 20 municipalities across Flanders, Wallonia, and the Brussels region. Across locations, seasonal patterns are consistent. All three pollutants increase as temperatures fall, with nitrogen dioxide showing the strongest seasonal response—rising by roughly 20% from autumn to winter.
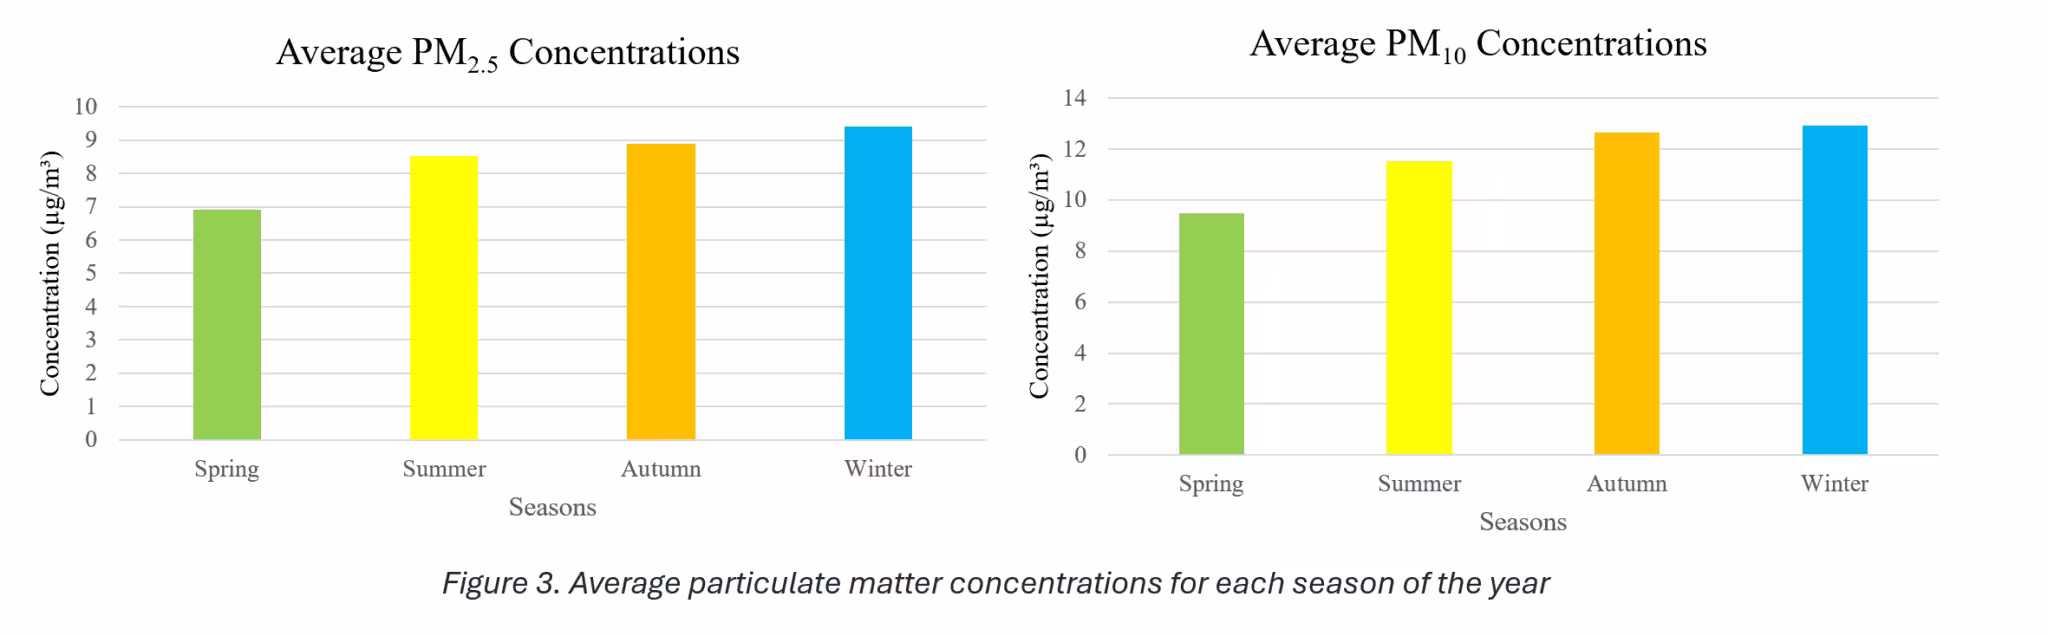
Concentrations are lowest in spring, when changing wind directions and increased wind speeds promote dispersion. Despite this seasonal relief, PM2.5 and NO2 exceed WHO thresholds throughout the year. PM10 generally remains within limits across all seasons.
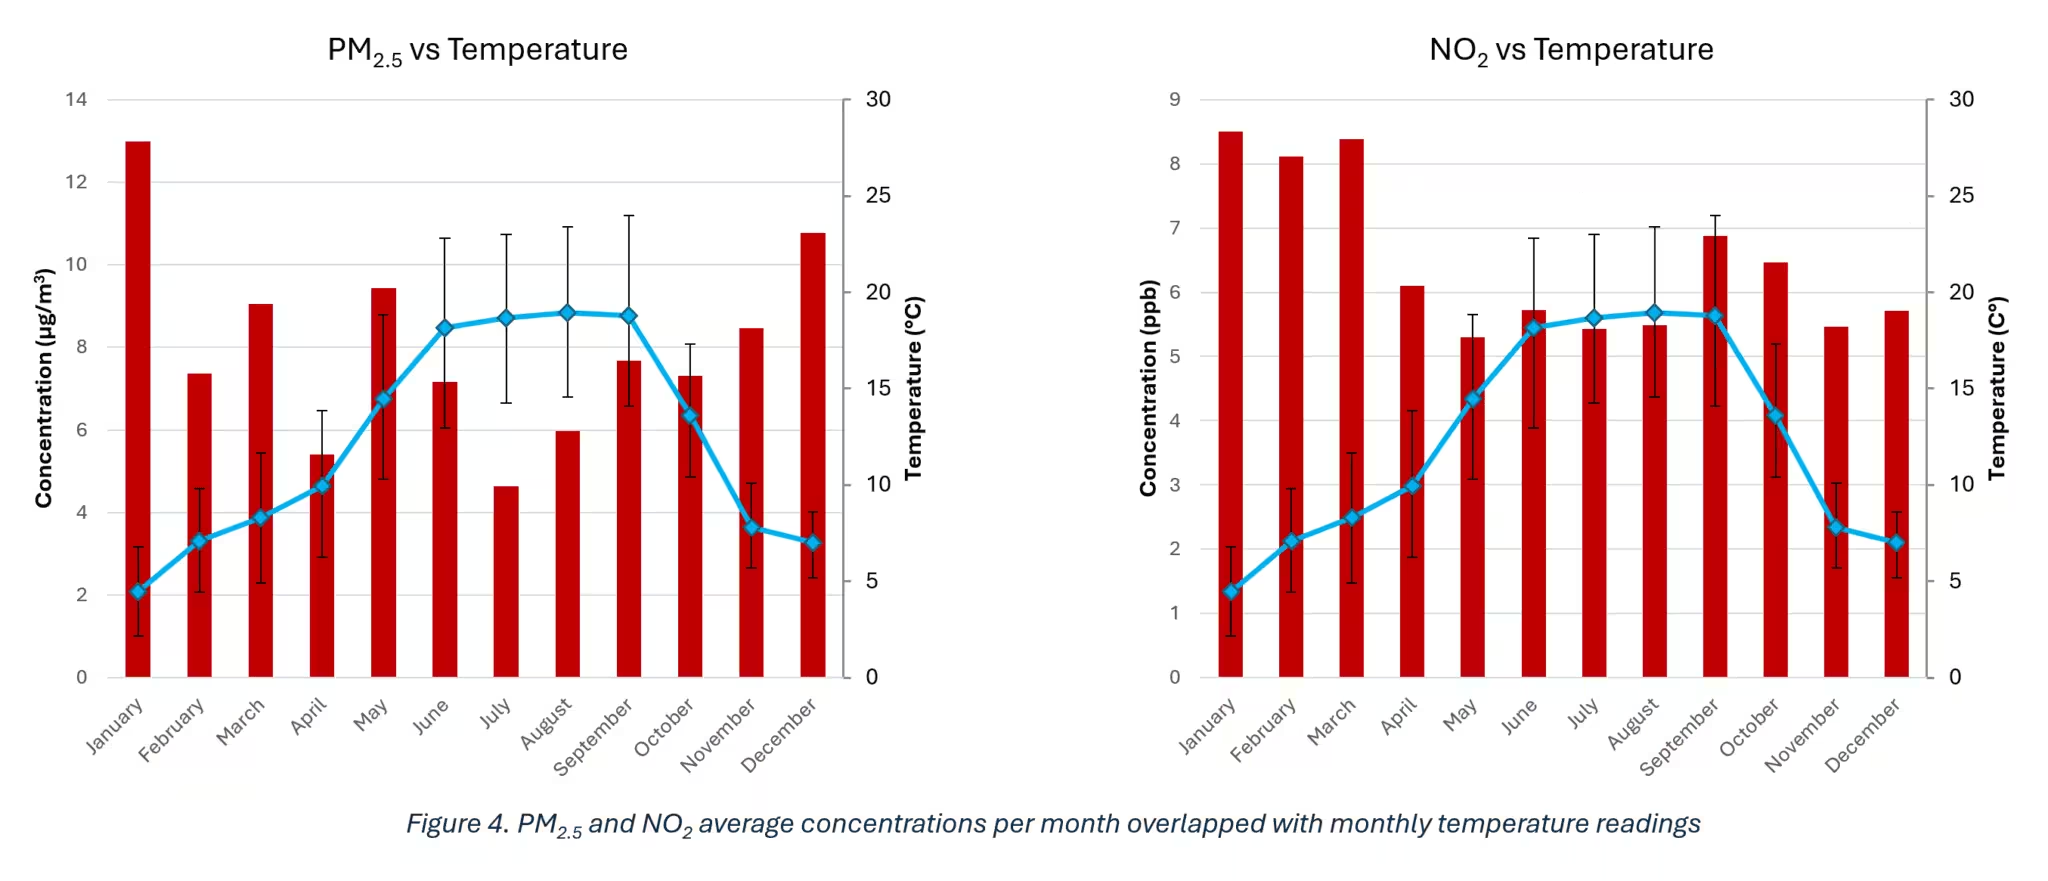
When pollutant concentrations are compared with meteorological data from the IRM, the drivers become clearer. Winter peaks reflect increased residential heating and transport emissions, combined with atmospheric conditions that trap pollutants near the surface. Although higher temperatures promote NO2 formation, increased solar radiation during warmer months accelerates breakdown reactions, leading to lower net concentrations.
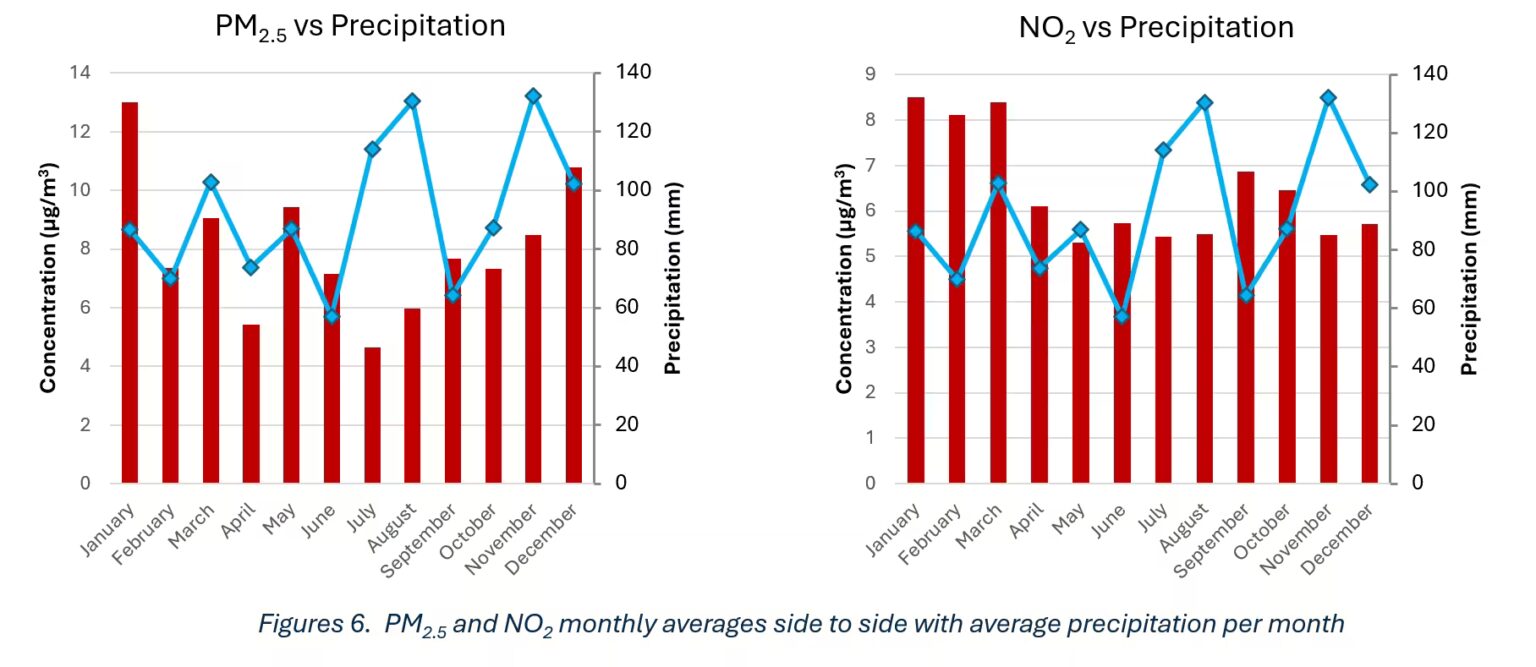
Rainfall and wind effects are visible but not absolute. July and August, which recorded high rainfall, also showed some of the lowest PM2.5 and NO2 concentrations. November, despite heavy rain, did not see a comparable reduction, indicating that precipitation alone cannot offset other dominant factors. Higher wind speeds correlated more strongly with particle resuspension than dispersion, leading to higher particulate concentrations during windy periods.
Atmospheric pressure remained relatively stable during warmer months before rising sharply in winter. Higher pressure correlated with increased concentrations, particularly for heavier particles such as PM10.
What comes next
Transport policies play a central role. Expanding public transport and accelerating the shift to electric vehicles directly reduce NO2 emissions. Industrial emission controls become more important during colder months, when dispersion is limited.
Seasonal variation demands targeted responses. Reducing emissions of nitrogen dioxide and fine particulate matter remains critical, particularly during winter, when concentrations consistently exceed health-based thresholds.
Residential emissions are equally significant. Studies suggest that residential heating accounts for at least 60% of particulate emissions. Reducing reliance on wood-burning stoves, improving insulation, optimising heating schedules, and deploying automated heating systems can all reduce wintertime exposure. Renovation remains a final option where buildings are poorly insulated.
Urban green spaces offer additional mitigation by absorbing pollutants and moderating local temperatures. At the policy level, aligning local regulations with WHO thresholds would provide a clearer health-based benchmark for year-round protection.
Seasonal data does not simplify air quality management. It complicates it. But it also makes intervention more precise—provided cities are willing to measure conditions as they actually occur, rather than as averages suggest they should.