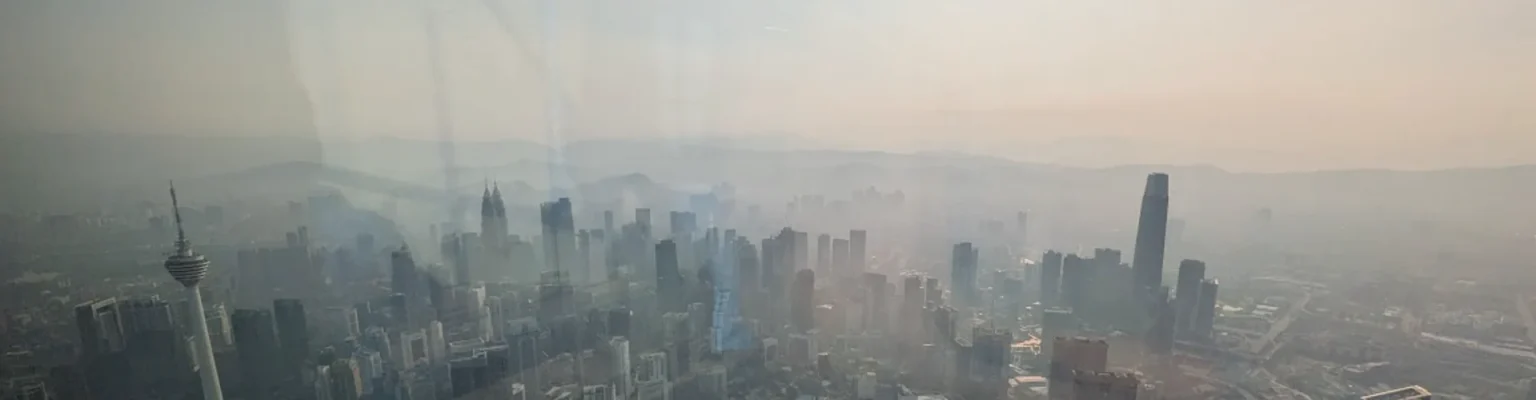
Excellent air quality has typically been associated with remote towns and low-density regions with favourable weather, not with dense, high-rise cities packed with traffic and construction. For smart cities to be a reality in the near future, solving the complex challenge of breathable air quality remains one of the vision’s most consequential prerequisites.
The foundational technologies are already in place in a number of the world’s most advanced cities. A growing number of the world’s most crowded urban centers are treating clean air as a measurable engineering outcome rather than a geographic inheritance. The approach behind their results serves as a blueprint for the future of air quality management for large urban centers. It relies on specific, repeatable actions: dense monitoring networks that give planners hyperlocal data, regulation that targets the largest emission sources, transport systems designed to reduce driving, green infrastructure placed according to measured airflow rather than available land, and community programmes that turn residents into active participants in tracking their own air. Tracking these early, data-driven interventions reveals the exact mechanisms to transition urban environments toward the smart city model.
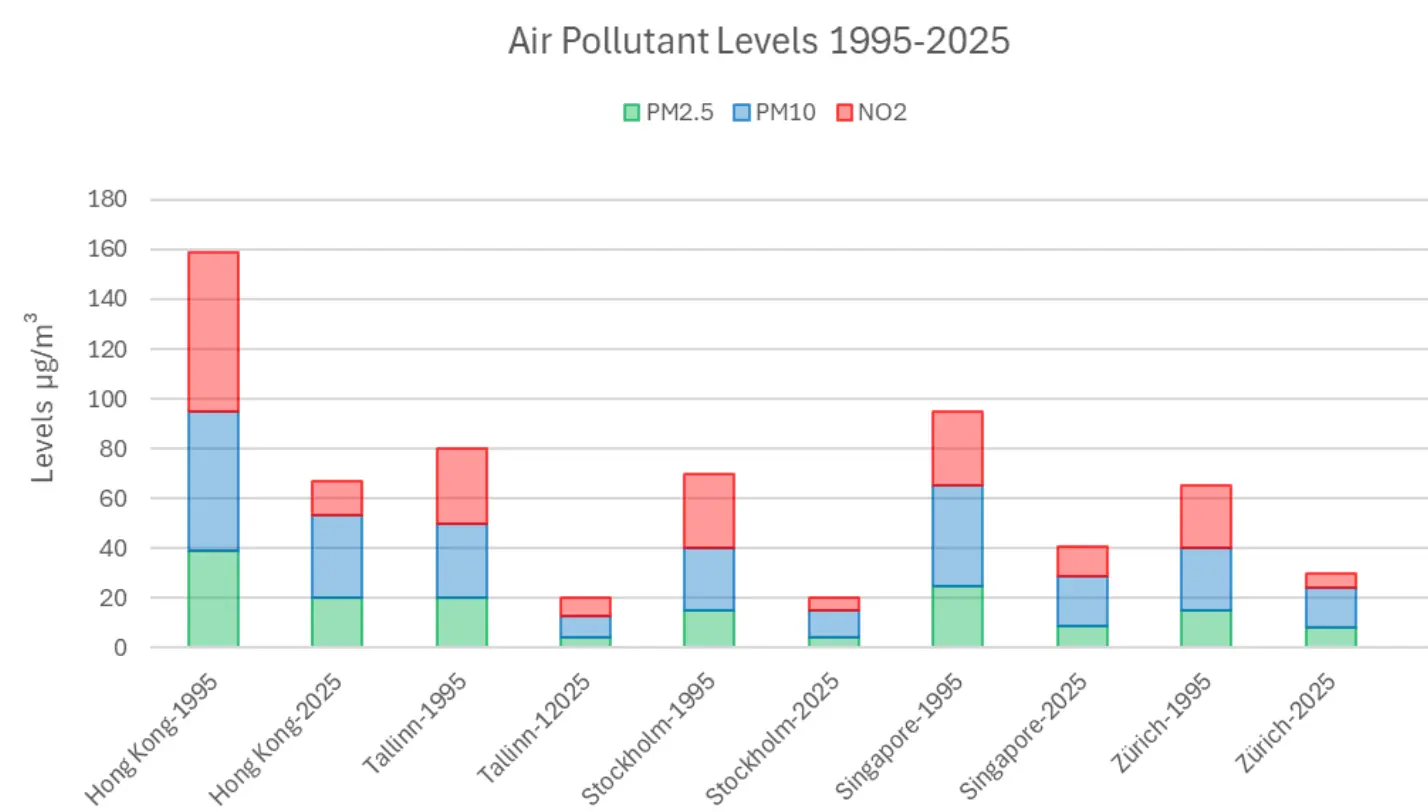
Singapore’s National Environment Agency tracks urban pollution at the neighbourhood level. Stockholm’s congestion charge is two decades old and still tightening its grip on city-centre traffic. Zürich’s transit system carries enough daily commuters to keep car ownership among the lowest of any wealthy European city. These modern cities and others are tackling urban air quality from different directions, and the sections below explore how each approach works at scale.
Data-Driven Air Quality Management
Air quality management in most cities still relies on a small number of regulatory monitoring stations, often spaced tens of kilometers apart, each reporting averaged readings that smooth over the hyperlocal variations where exposure actually happens. Cities face pollutants such as PM10, PM2.5, and nitrogen dioxide (NO₂), primarily from vehicles, industry, and construction, which can cause serious health problems. They might know their daily PM2.5 average across a metropolitan area, but remain blind to the fact that a single intersection near a school consistently exceeds safe thresholds during morning drop-off, or that construction dust from a nearby site migrates three blocks south every afternoon when the wind shifts.
The cities with the cleanest urban air have moved past this model. Singapore’s NEA operates one of the world’s densest urban sensor networks. This system resolves pollutant concentrations at the neighbourhood level, giving policymakers the granularity to adjust traffic flows, issue location-specific health advisories, and identify pollution hotspots that a sparser network would average into the background. The data feeds directly into infrastructure responses, including building ventilation systems that modulate outdoor air intake based on ambient conditions, maintaining healthy indoor environments even during pollution events.
This kind of infrastructure changes the nature of the decisions a city can make, and it explains why monitoring networks keep appearing as the common foundation beneath every smart city vision in the world.
How Urban Planners Use Air Quality Data to Combat Pollution
Stuttgart publishes a climate atlas that maps how air moves through the city. Urban planners use it to protect ventilation corridors that channel clean air from the surrounding hills into the dense city center. The system exists because Stuttgart sits in a valley prone to temperature inversions that trap pollutants at street level, and decades of monitoring data showed planners exactly where stagnation occurs and where fresh air penetrates.
This same pattern is emerging across other cities taking air quality planning seriously. London’s Ultra Low Emission Zone, the largest in the world, was drawn and later expanded using monitoring data that revealed the worst vehicle emission concentrations and respiratory health outcomes.
The depth of monitoring data drives these interventions. Stuttgart’s planners understand street-level airflow in specific weather conditions through continuous, multi-year measurement. London expanded the ULEZ because its network confirmed substantial drops in concentrations inside the original boundary, providing measured evidence to justify scaling outward.
Where cities lack that monitoring resolution, planning interventions default to administrative convenience. Zone boundaries follow borough lines. Green corridors land where space allows. Building orientation decisions happen without local airflow pattern data. The planner working from a handful of national compliance stations spaced 50 kilometers apart cannot answer the questions that street-level design demands: which intersections exceed safe thresholds during school hours, where construction dust migrates after a site shuts down, or whether a proposed tree buffer will intercept a PM2.5 plume or trap it at pedestrian level by restricting airflow in a narrow street canyon.
Dense, continuous sensor networks close this gap. In Belgium, Airscan and Belfius’ Villes pures impact project deploys outdoor sensors across 60+ municipalities, generating the hyperlocal data that allows planning to move from estimation to certainty. De l'air pur pour les écoles places sensors in the environments where children spend their days, giving school districts a continuous record of actual exposure during school hours. In Kuala Lumpur, Airscan is supporting the SETARA initiative, which is building the same foundation: deploying sensors on EDOTCO Group’s existing telecoms towers across the city center and giving KL’s City Hall a before-and-after measurement capability for the first time.
The infrastructure in each case is relatively light. What shifts is the resolution and speed of the data available to the people making planning decisions, and the ability to measure whether an intervention actually changed conditions on ground.
Strong Regulation of Vehicles and Industry
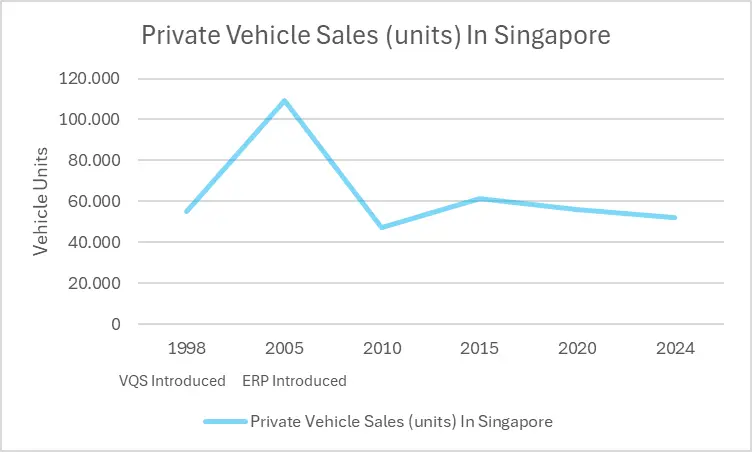
Singapore’s Vehicle Quota System (VQS) caps the number of private vehicles registered in the city state, while its Electronic Road Pricing (ERP) charges drivers variable tolls based on time and route, directly suppressing congestion during peak hours. The city also enforces Euro VI emission standards on all new vehicles, and it has relocated industrial zones to dedicated enclaves away from residential areas, removing the largest stationary emission sources from populated districts entirely.
London took a different regulatory path, creating the ULEZ in 2019 and progressively expanding it until it covered all London boroughs. Vehicles that fail to meet emission standards pay a daily charge to enter the zone, and the monitoring data published since the original boundary went live showed meaningful reductions in NO₂ and particulate matter in the affected areas. The measured results in the original zone gave Transport for London the evidence base to expand the boundary, which is a useful model of how monitoring infrastructure and regulatory design reinforce each other: the regulation creates the intervention, the monitoring proves the effect, and the proven effect justifies expanding the intervention.
What these regulatory frameworks share is specificity. They target the emission sources that monitoring data identifies as dominant, whether those are private vehicles, diesel commercial fleets, or industrial processes, and they build in mechanisms for review and tightening as conditions and technology change. Regulation designed without granular data tends to apply uniform rules across a city, treating a low-traffic residential street the same as a congested arterial road. Data-informed regulation targets the places and sources where the reduction will register, establishing the policy mechanisms necessary to turn smart cities from conceptual blueprint into an operational reality.
Clean Public Transport as Infrastructure
Zürich and Stockholm both run highly integrated, electrified public transport systems. Zürich’s trams and buses are powered by renewable energy, and the city has designed its transit network to make public transport consistently faster and more convenient than driving for most urban journeys. Stockholm’s congestion charge, introduced in 2006 as a trial and made permanent after a public referendum, reduced car traffic in the city centre by roughly 20% and produced measurable improvements in central air quality. Other smart city candidates such as Hong Kong and Singapore run two of the best public transport networks in the world due to their high reliability, low cost, and seamless connections.
The effect of clean public transport with high ridership is a mechanical improvement in air quality: every passenger-trip that moves from a private combustion engine vehicle to an electric tram or bus removes tailpipe emissions from street level. The cities that perform best on outdoor air quality tend to be the ones where public transport is reliable and integrated enough that residents choose it over private cars without feeling they are making a sacrifice. Zürich and Stockholm have both achieved this, and the air quality data reflects the cumulative effect of decades of investment in making transit the default urban travel mode.
Urban Green Spaces that Filter Pollution
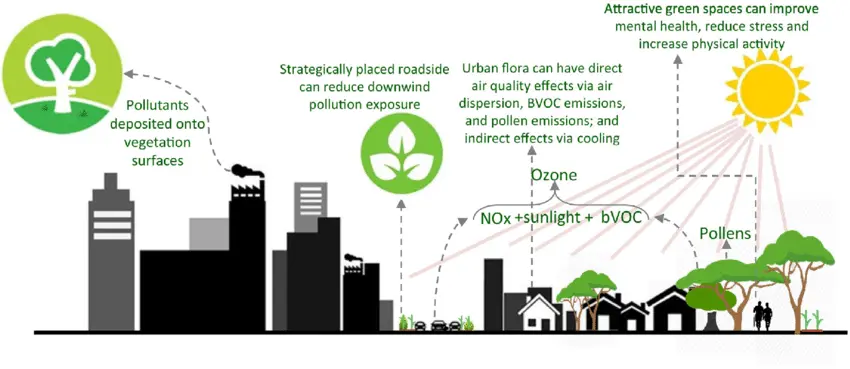
The conventional case for urban green spaces leans on broad claims about trees absorbing carbon and “purifying the air”. The reality is more specific and more interesting: green infrastructure improves air quality when it is designed and placed to intercept pollution where pollution concentrates, and it can make air quality worse when planted without reference to local airflow patterns. Tall, dense tree canopies in narrow street canyons can restrict ventilation and trap pollutants at pedestrian breathing height.
The urban centers emerging as the strongest candidates for future smart cities produce their most significant results by treating green spaces as an engineering intervention informed by continuous monitoring data.
Medellín, Colombia, launched its Green Corridors project in 2016, transforming 18 roads and 12 waterways into as a connected 20-kilometer network of shade and vegetation. The programme planted over 880,000 trees and 2.5 million smaller plants across 30 corridors, trained 75 residents from disadvantaged communities as full-time urban gardeners, and produced measurable results within three years. Between 2016 and 2019, PM2.5 levels across the corridor areas dropped from 21.81 µg/m³ to 20.26 µg/m³, and morbidity from acute respiratory infections fell from 159.8 to 95.3 per 1,000 people. The programme won the 2019 Ashden Award for Cooling by Nature.
Seoul’s Wind Path Forest project takes a different approach, planting corridors of air-purifying species along routes that connect the mountains surrounding the city to dense urban core. The goal is to channel clean mountain air into districts where heat islands and traffic emissions create the worst conditions. A 2021 study by Korea’s National Institute of Forest Science found that Hongneung Forest in northeast Seoul lowered PM10 levels by 26% and PM2.5 by 41%, demonstrating what purpose-built green infrastructure can achieve when its position and species composition are chosen for air quality performance.
Singapore’s “City in a Garden” programme takes this a step further by integrating vegetation directly into the built environment, covering building facades, rooftops, and transit infrastructure with planting informed by measured environmental conditions. The vegetation serves multiple purposes simultaneously: pollutant filtration, temperature reduction, and stormwater management, all calibrated against data from the city’s monitoring network.
Community Monitoring and Public Engagement
Sustaining clean air across smart cities requires public engagement that goes beyond awareness campaigns and information posters. The most effective community programmes are the ones that put monitoring data directly in residents’ hands, turning passive concern about air quality into informed, specific action.
London’s Breathe London project deployed a network of hyperlocal air quality sensors across the city, collecting high-resolution pollution data and making it publicly accessible. The project gave community groups and local councils granular evidence for the first time: which specific streets exceeded safe PM2.5 levels, which school playgrounds were exposed during break times, and where traffic interventions were having a measurable effect. The data fed directly into policy advocacy at the borough level.
Closer to our home market, Belgium and France’s TransfAIR project ran from 2019 to 2022 across Flanders, Hauts-de-France, and Wallonia, distributing portable air quality monitors to individuals and families through a gamified programme called “AERO Adventure”. Participants measured air quality inside and outside their homes, learning how their daily routines, commuting choices, and cooking habits affected the air they breathed. The cross-border collaboration between Belgian and French monitoring agencies produced a participatory model where citizens generated useful data while developing a practical understanding of what shapes their air quality exposure.
What these programmes share is a shift from telling residents about pollution to equipping them to observe pollution themselves. The data creates engagement that information campaigns alone cannot sustain.
What is the Future of Air Quality Management for Large Cities?
Most city-scale air quality programmes are designed around a single domain: outdoor pollution. Sensor networks track PM2.5 across neighbourhoods, monitoring stations report NO₂ and ozone, and the data feeds planning decisions and public health advisories. The cities we discussed here are mastering outdoor air in different ways, but the next evolution of the smart city is taking that data indoors.
Because the indoor picture is still largely absent from that conversation. This matters in practical terms because most people in large cities spend approximately 90% of their day inside buildings, where pollutant concentrations are shaped by a combination of outdoor infiltration, internal sources like off-gassing and occupancy load, and the buildings ventilation behaviour. A city can make meaningful progress on outdoor air quality while its commercial buildings continue to recirculate air at fixed rates, with ventilation systems running on schedules set during commissioning and rarely revisited.
The consequences show up in specific, routine scenarios. When an outdoor pollution event develops, whether a construction dust plume, a traffic-induced NO₂ spike or a haze episode – like the ones caused by the horrific Indonesian peatland fires that essentially destroy air quality across the entire Southeast Asian region for months at a time each year – a building ventilation system running on a timer draws the same volume of outdoor air as on a clean day. During the haze period, shockingly, some modern offices we help with continuous monitoring have indoor air quality levels rising and falling at the exact same levels as the outdoors. This can only be the result of the ventilation system pulling in poorly filtered outdoor air that even with a completely sealed office, you’re essentially breathing outdoor air – for better or worse.
The next generation of air quality management for large cities will connect three layers that currently operate in isolation. Outdoor sensor networks track conditions across the city in continuous hyperlocal resolution. Indoor monitors in occupied spaces track what is reaching the people inside buildings, measuring pollutant concentrations, CO₂, humidity and volatile organic compounds in real time. Ventilation systems draw on both data streams, damping outdoor air intake when conditions outside deteriorate and increasing fresh air supply when conditions improve, with room-by-room modulation based on real-time indoor readings and occupancy.
Each of these layers already deploys individually in cities around the world. The SETARA network in Kuala Lumpur gives city planners a continuous outdoor data layer at street level. Airscan runs indoor air quality monitoring systems in office buildings, hospitals, and schools across Belgium and Malaysia. Ventilation systems that adjust airflow based on indoor CO₂ have been available for years. The shift is in connecting the three layers into a single feedback loop where outdoor conditions inform indoor decisions and ventilation responds without human intervention.
Regulation is accelerating this convergence. The European Performance of Buildings Directive (EPBD), with enforcement beginning in 2027, will require continuous environmental performance monitoring in new and renovated buildings across EU member states. Belgian regions are currently transposing the directive, with Flanders expected to vote on its decree in late 2026. In Southeast Asia, Malaysia’s DOSH ICOP IAQ 2010 already mandates indoor air quality compliance for commercial buildings, creating regulatory conditions where continuous indoor monitoring is an operational requirement.
Smart Cities Show How to Have Good Outdoor Air Quality
A smart city, in air quality terms, is one where monitoring data continuously informs planning, regulation, transport, green infrastructure, and public engagement as parts of a connected system. The component parts of that model are already operating at urban scale – from Stuttgart’s ventilation corridor planning to Singapore’s “City in a Garden” programme to London’s ULEZ expansion, each driven by measured data – and the cities moving fastest toward integration are the ones building the monitoring infrastructure that connects each layer to the others.
At the foundation of each strategy is continuous, granular measurement that makes it possible to design interventions precisely and verify whether they worked. Airscan builds this foundation for cities, businesses, and building operators through outdoor monitoring networks, indoor air quality systems, and smart ventilation that connects both layers into a single feedback loop, closing the gap between measurement and improvement.
Explore the solutions driving this shift in urban environmental management: