Ambient air quality in European cities has moved from a technical concern to a public health priority. A growing body of evidence links air pollution to respiratory and cardiovascular disease, as well as increased premature mortality. That concern sharpened in 2021, when the World Health Organization released updated air quality guidelines that significantly lowered recommended exposure limits.
Against this backdrop, Airscan conducted a technical review of outdoor air pollution trends across Belgium’s largest urban centres. The analysis examines how key pollutants have evolved over the past five years in Brussels, Antwerp, Ghent, Charleroi, and Liège—cities that together capture a large share of the country’s urban exposure.
Analysis overview
The assessment draws on open-source data from IRCELINE, Belgium’s national air quality monitoring network. To ensure transparency and comparability, one urban background reference station was selected in the centre of each city:
- Brussels – Station 41R001 (Chaussée de Ninove, Molenbeek-Saint-Jean)
- Antwerp – Station 42R805 (Belgiëlei, Antwerp)
- Ghent – Station 44R701 (Koning Willem I-kaai, Ghent)
- Charleroi – Station 45R501 (Rue Émile Tumelaire, Charleroi)
- Liège – Station 43R222 (Rue du Chéra, Liège)
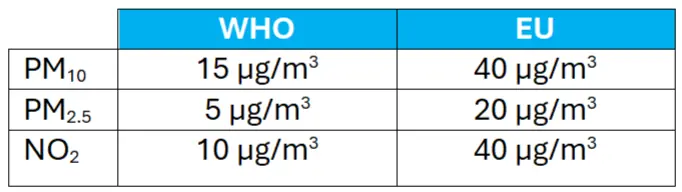
The analysis focuses on three pollutants that are widely used as indicators of urban air quality: particulate matter with an aerodynamic diameter below 10 micrometres (PM10), fine particulate matter below 2.5 micrometres (PM2.5), and nitrogen dioxide (NO₂). Measured values were compared against threshold limits set by both the European Union and the World Health Organization.
Particulate matter (PM10)
Across the five cities, annual average PM10 concentrations exceeded WHO guideline values throughout most of the 2019–2023 period. Charleroi was the sole exception in 2023, recording an average concentration of 13.4 µg/m³. All reported values, however, remained within current European Union limit values.
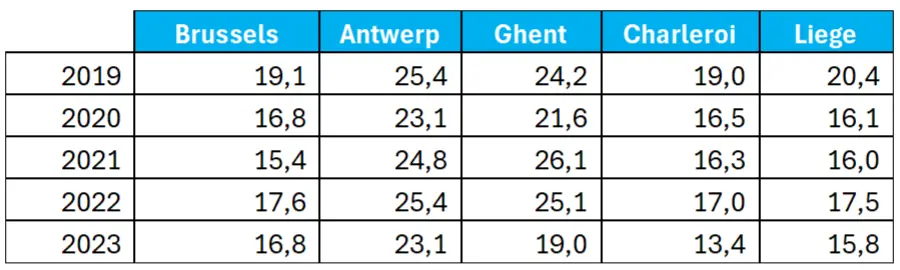
City-level trends show no single, stable national pattern. In Brussels, PM10 concentrations reached a minimum in 2021 before rising slightly in subsequent years, returning to levels comparable to 2020. Antwerp showed limited improvement, with annual averages fluctuating between 23 and 25 µg/m³ across the period.
Ghent recorded a more pronounced shift. Between 2022 and 2023, average PM10 concentrations fell by approximately 24%. Despite this reduction, levels remained above the latest WHO guideline. In Wallonia, Liège showed a modest decline after a peak in 2019, followed by relative stability, while Charleroi reached its lowest recorded PM10 level in 2023.
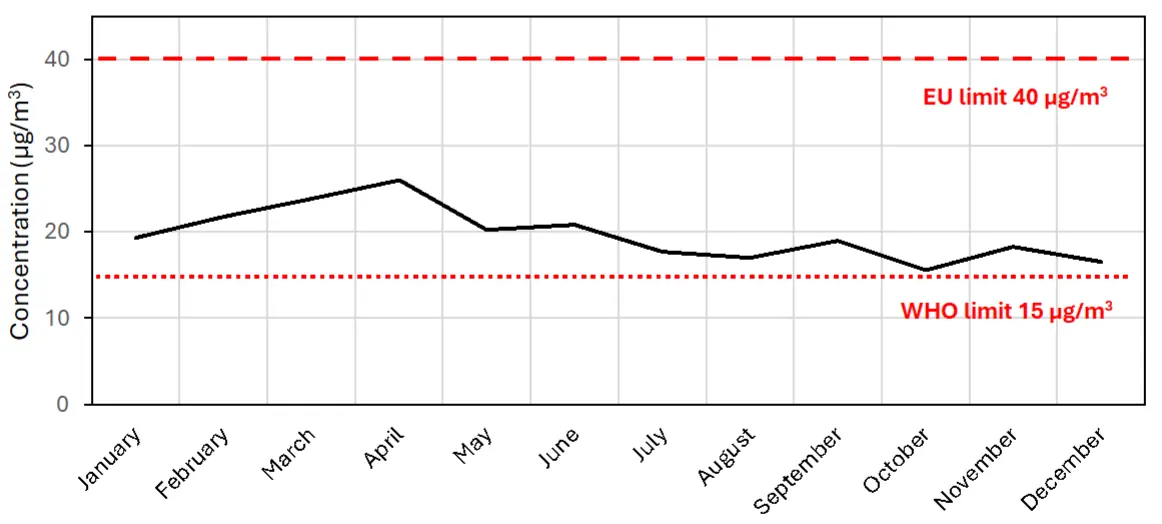
Seasonal aggregation highlights a consistent pattern across cities. Average PM10 concentrations peak during the winter–spring period, with the highest values typically observed in April. The trend reflects a combination of residential heating emissions and increased particulate matter linked to pollen and secondary aerosols.
Fine particulate matter (PM2.5)
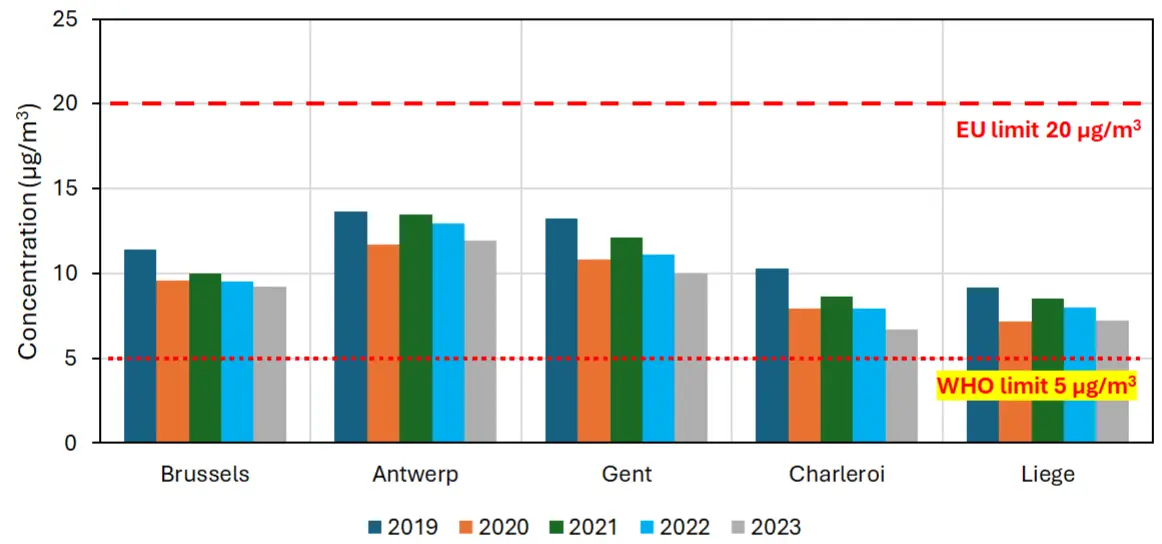
Fine particulate matter followed a similar trajectory. Average annual PM2.5 concentrations exceeded WHO guideline values in all cities included in the study, while remaining below current EU limit values. In roughly half of the observations, measured concentrations were more than twice as high as the WHO threshold.
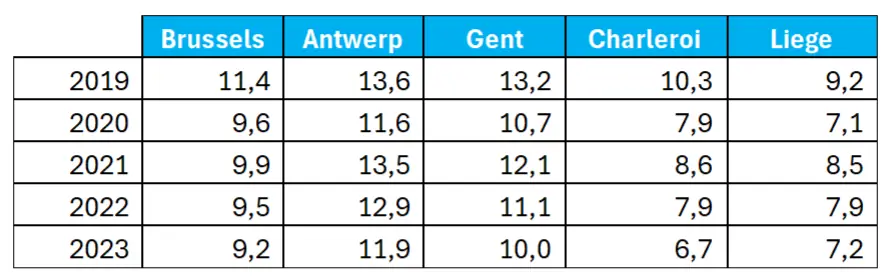
As with PM10, no consistent city-wide trend emerged, with one notable exception. A marked reduction in PM2.5 concentrations was observed in 2020, coinciding with COVID-19 lockdown measures and a sharp reduction in traffic and industrial activity.
Nitrogen dioxide (NO₂)
Nitrogen dioxide concentrations mirrored the broader particulate matter trends. Average annual NO₂ values exceeded WHO guidelines while remaining well below EU limit values.
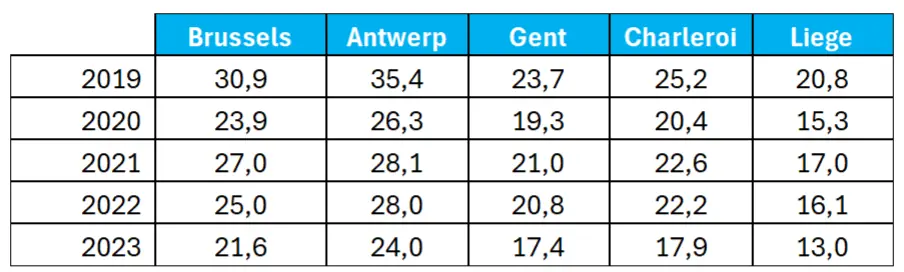
Antwerp recorded the highest annual average concentration in 2019 (35.4 µg/m³), while the lowest value was observed in Liège in 2023 (13 µg/m³). A sharp decline of more than 20% occurred between 2019 and 2020, largely attributable to reduced traffic during pandemic restrictions. Concentrations partially rebounded in the following two years but did not return to pre-pandemic levels. A further drop in 2023 resulted in the lowest national averages observed across the study period.
What the data suggests
Taken together, the findings reinforce a persistent gap between observed urban air quality in Belgium and the health-based limits defined by the WHO. With the exception of one PM10 measurement in Charleroi in 2023, none of the analysed annual averages fully met WHO guidelines.
This gap is likely to become more consequential. European air quality standards are currently under review and are expected to move closer to WHO recommendations. Even where cities comply with today’s EU limits, additional reductions will be required to meet future regulatory expectations.
At the same time, the data points to incremental progress. Concentrations measured in 2023 were generally lower than those recorded during the pre-pandemic years, despite the return of traffic and economic activity. Improvements in monitoring coverage, combined with targeted pollution-reduction initiatives, appear to be translating into measurable gains—albeit at a pace that remains uneven across cities.